

Question: The graph shows the function y = h(t). 5 4 -1 3 2 1 2 5 -1 -2 -3 -4 -5 6 I We
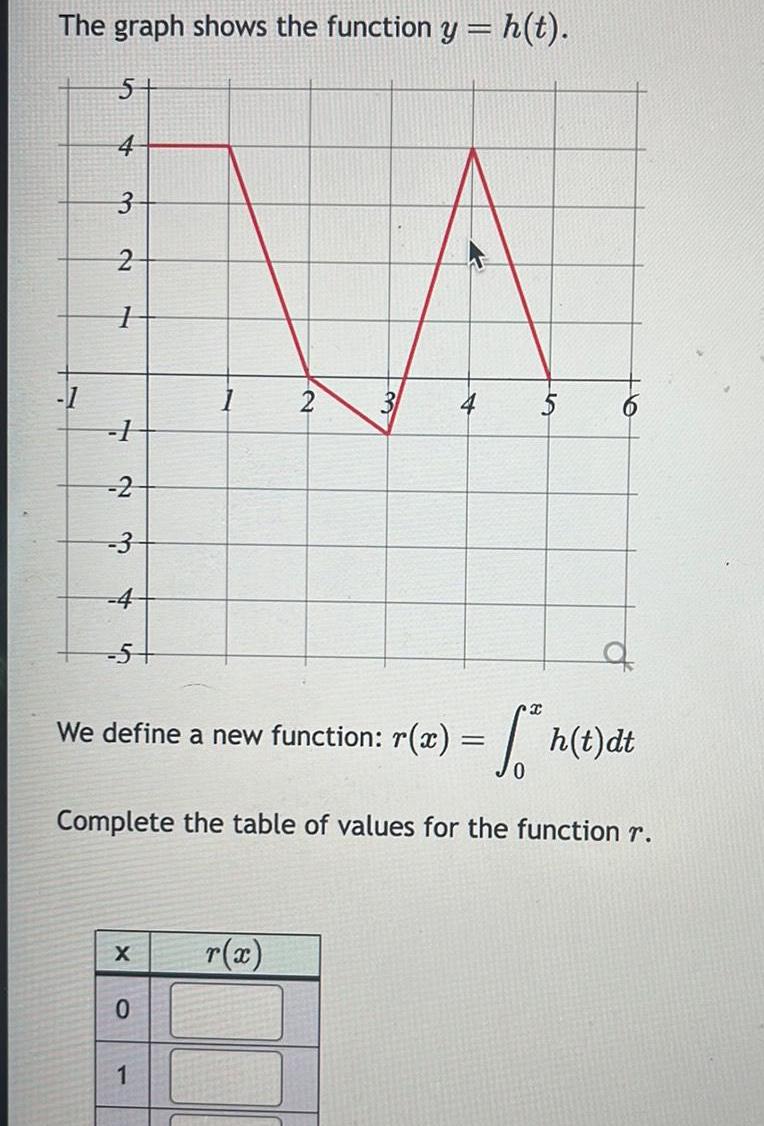
The graph shows the function y = h(t). 5 4 -1 3 2 1 2 5 -1 -2 -3 -4 -5 6 I We define a new function: r(x) = h(t)dt 0 Complete the table of values for the function r. X T(x) 0 1
Step by Step Solution
There are 3 Steps involved in it
1 Expert Approved Answer
Step: 1 Unlock

Question Has Been Solved by an Expert!
Get step-by-step solutions from verified subject matter experts
Step: 2 Unlock
Step: 3 Unlock