

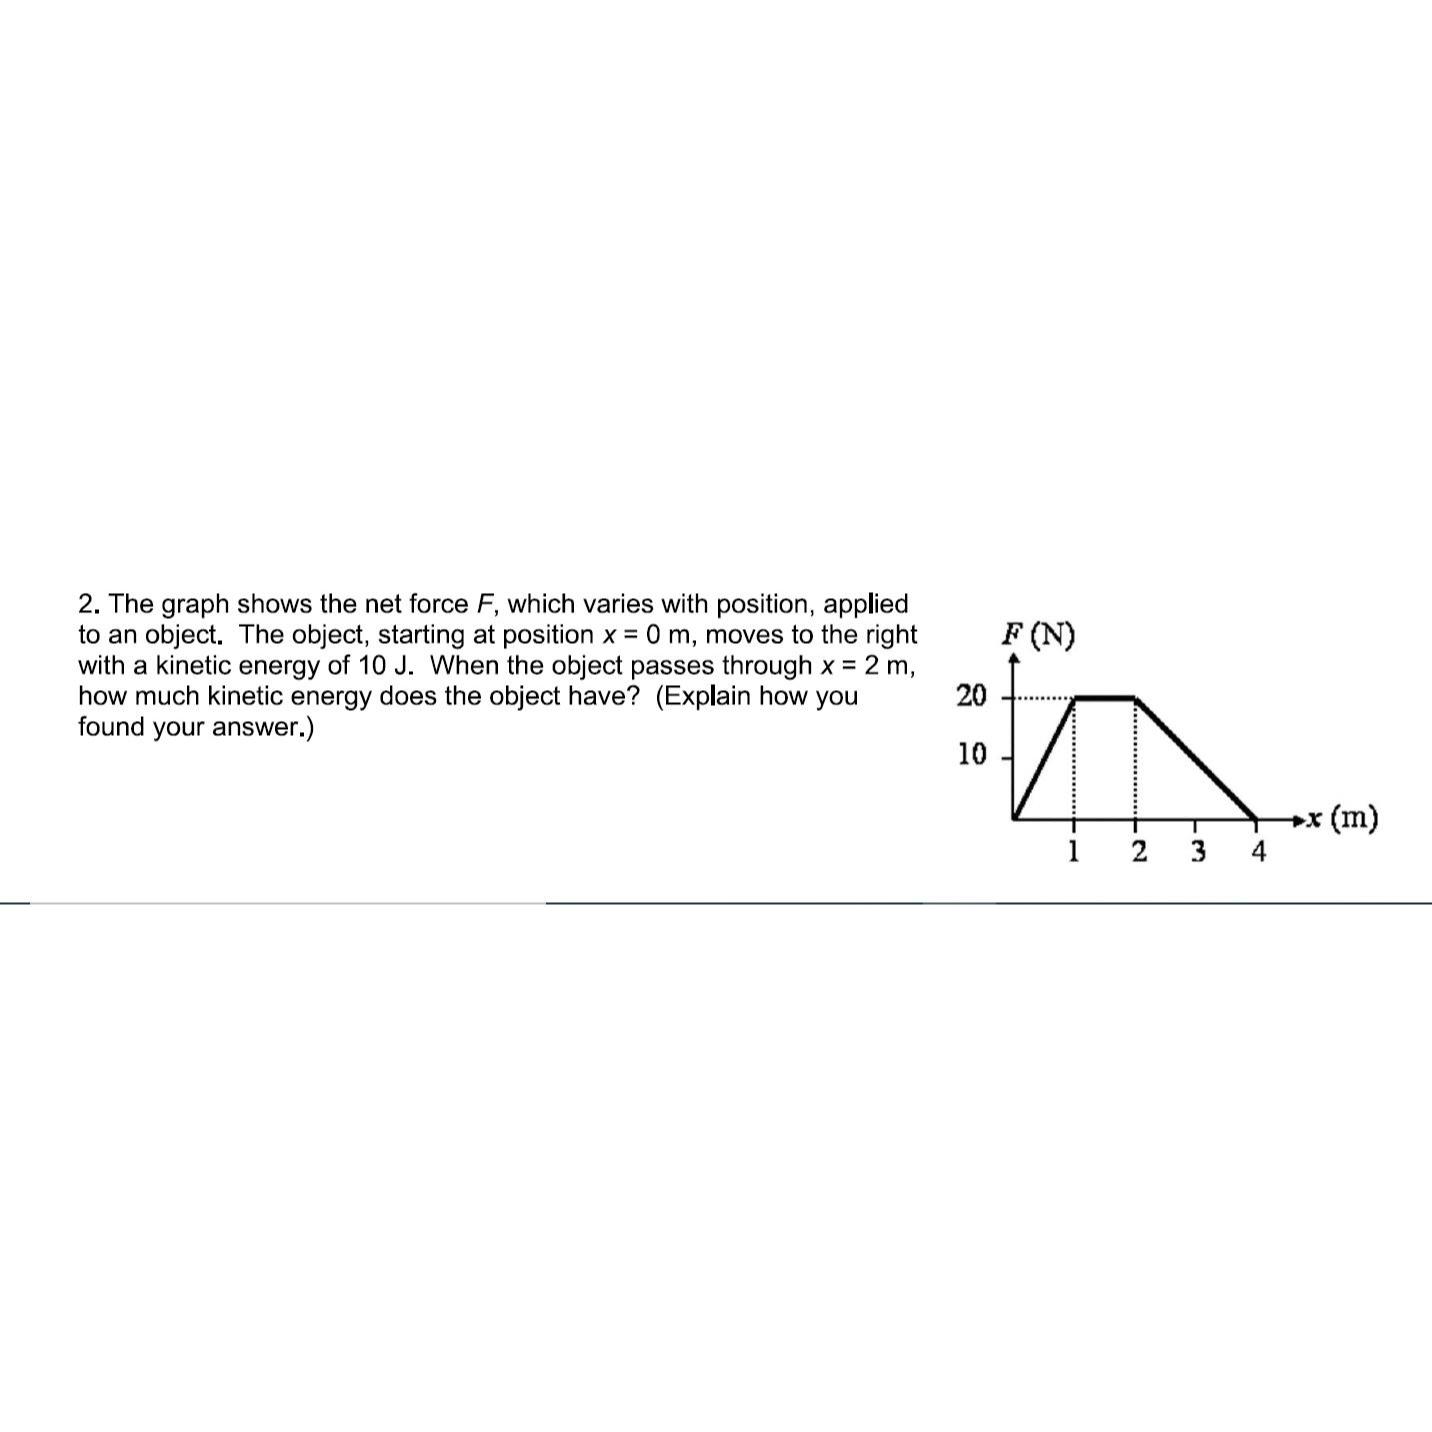
Question: The graph shows the net force F , which varies with position, applied to an object. The object, starting at position x = 0 m
The graph shows the net force which varies with position, applied to an object. The object, starting at position moves to the right with a kinetic energy of When the object passes through how much kinetic energy does the object have? Explain how you found your answer.
Step by Step Solution
There are 3 Steps involved in it
1 Expert Approved Answer
Step: 1 Unlock

Question Has Been Solved by an Expert!
Get step-by-step solutions from verified subject matter experts
Step: 2 Unlock
Step: 3 Unlock