

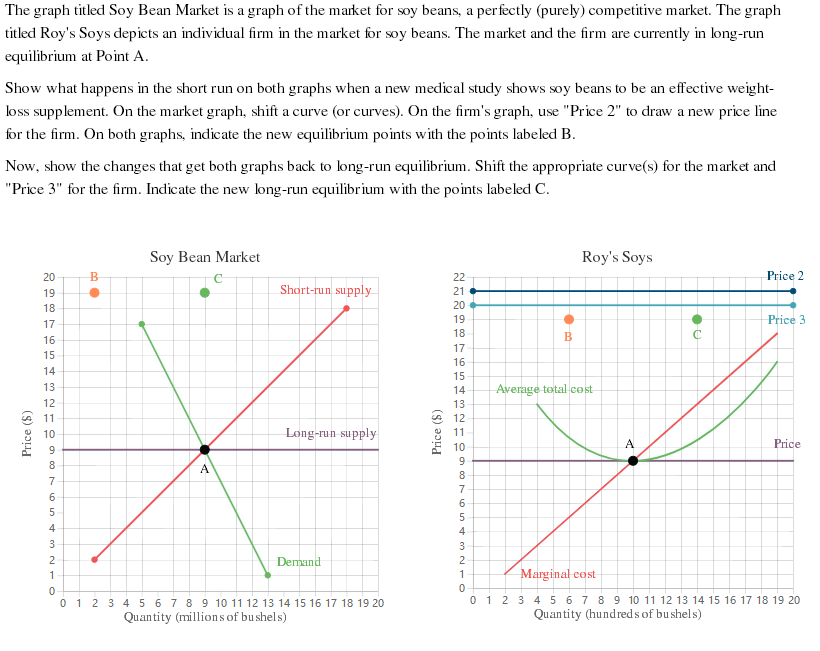
The graph titled Soy Bean Market is a graph of the market for soy beans, a...
Fantastic news! We've Found the answer you've been seeking!
Question:
Expert Answer:
The increase in demand for Soybeans shifts the demand curve to rightward D2 It interse... View the full answer

Related Book For 

Probability and Statistics for Engineering and the Sciences
ISBN: 978-1305251809
9th edition
Authors: Jay L. Devore
Posted Date:
