

Question: The graph to the right depicts how several assets plot on the security market line E[R] Security Market Line (SML). Securities B and F plot
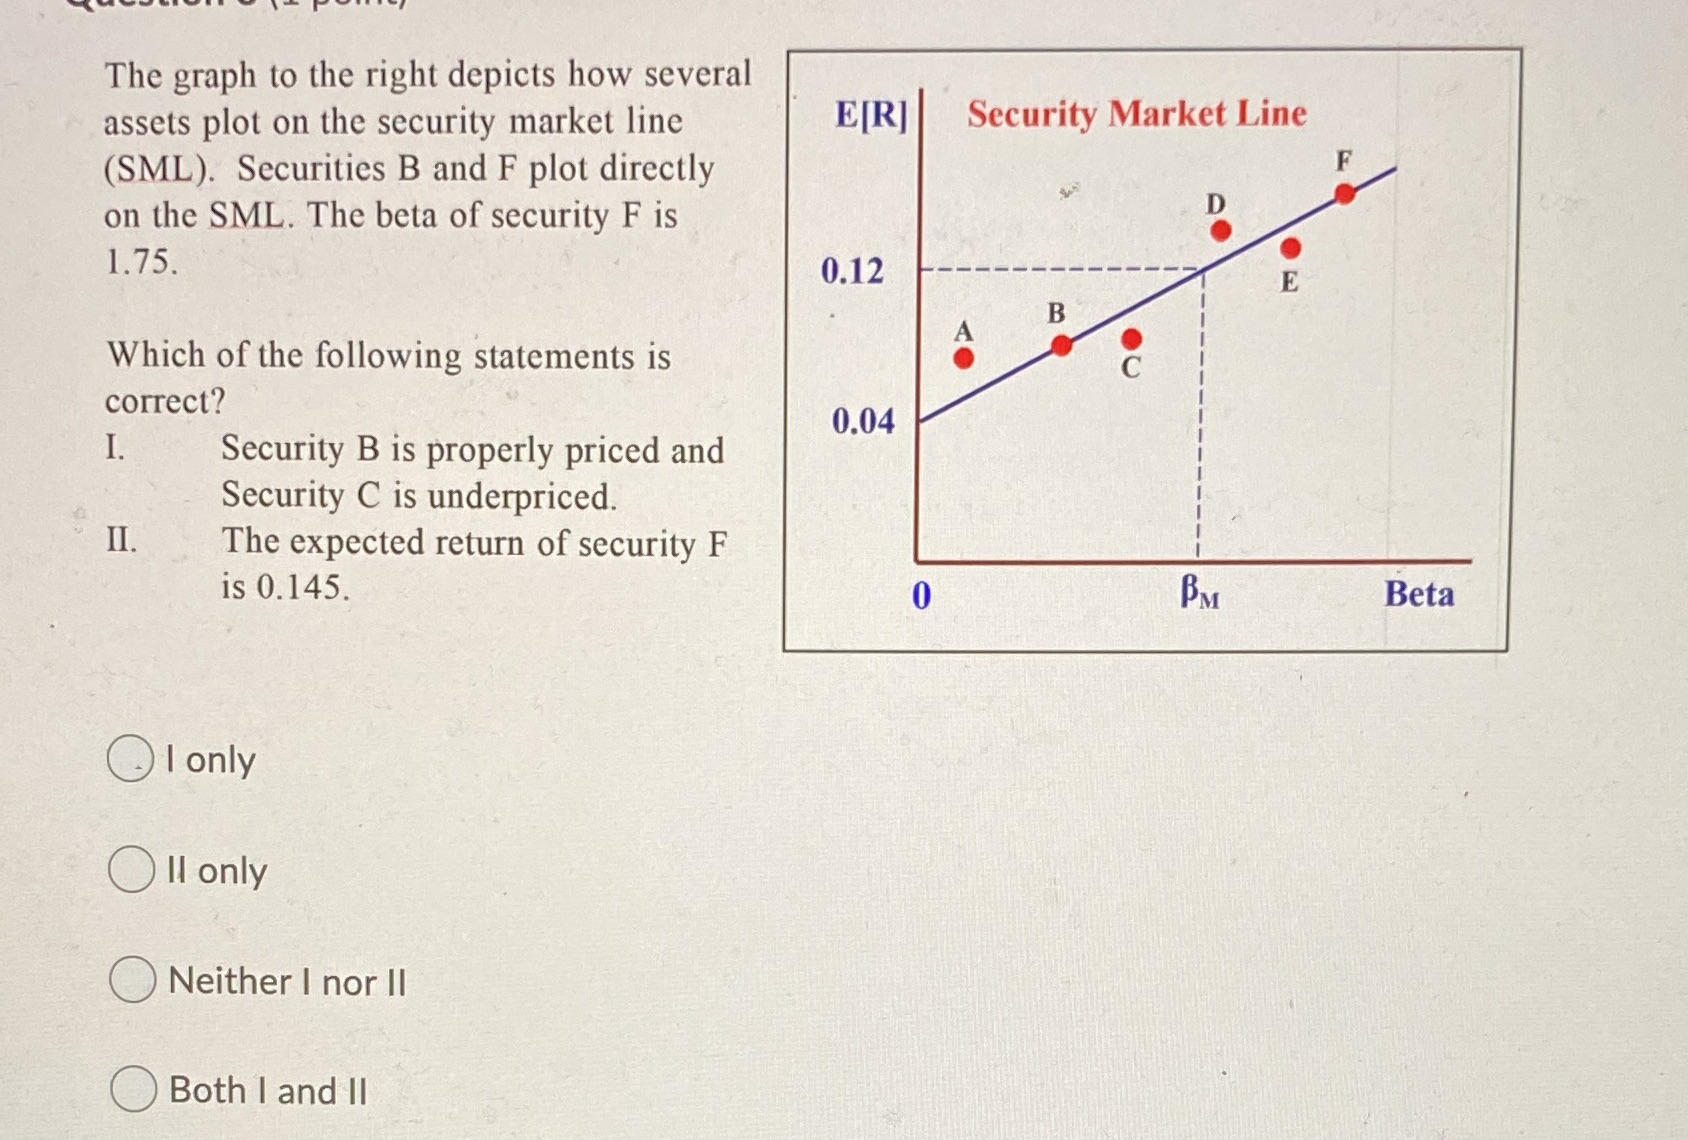
The graph to the right depicts how several assets plot on the security market line E[R] Security Market Line (SML). Securities B and F plot directly on the SML. The beta of security F is 1.75. 0.12 E B Which of the following statements is C correct? 0.04 I. Security B is properly priced and Security C is underpriced. II. The expected return of security F is 0.145. 0 BM Beta I only Oil only ONeither I nor II Both I and
Step by Step Solution
There are 3 Steps involved in it
1 Expert Approved Answer
Step: 1 Unlock

Question Has Been Solved by an Expert!
Get step-by-step solutions from verified subject matter experts
Step: 2 Unlock
Step: 3 Unlock