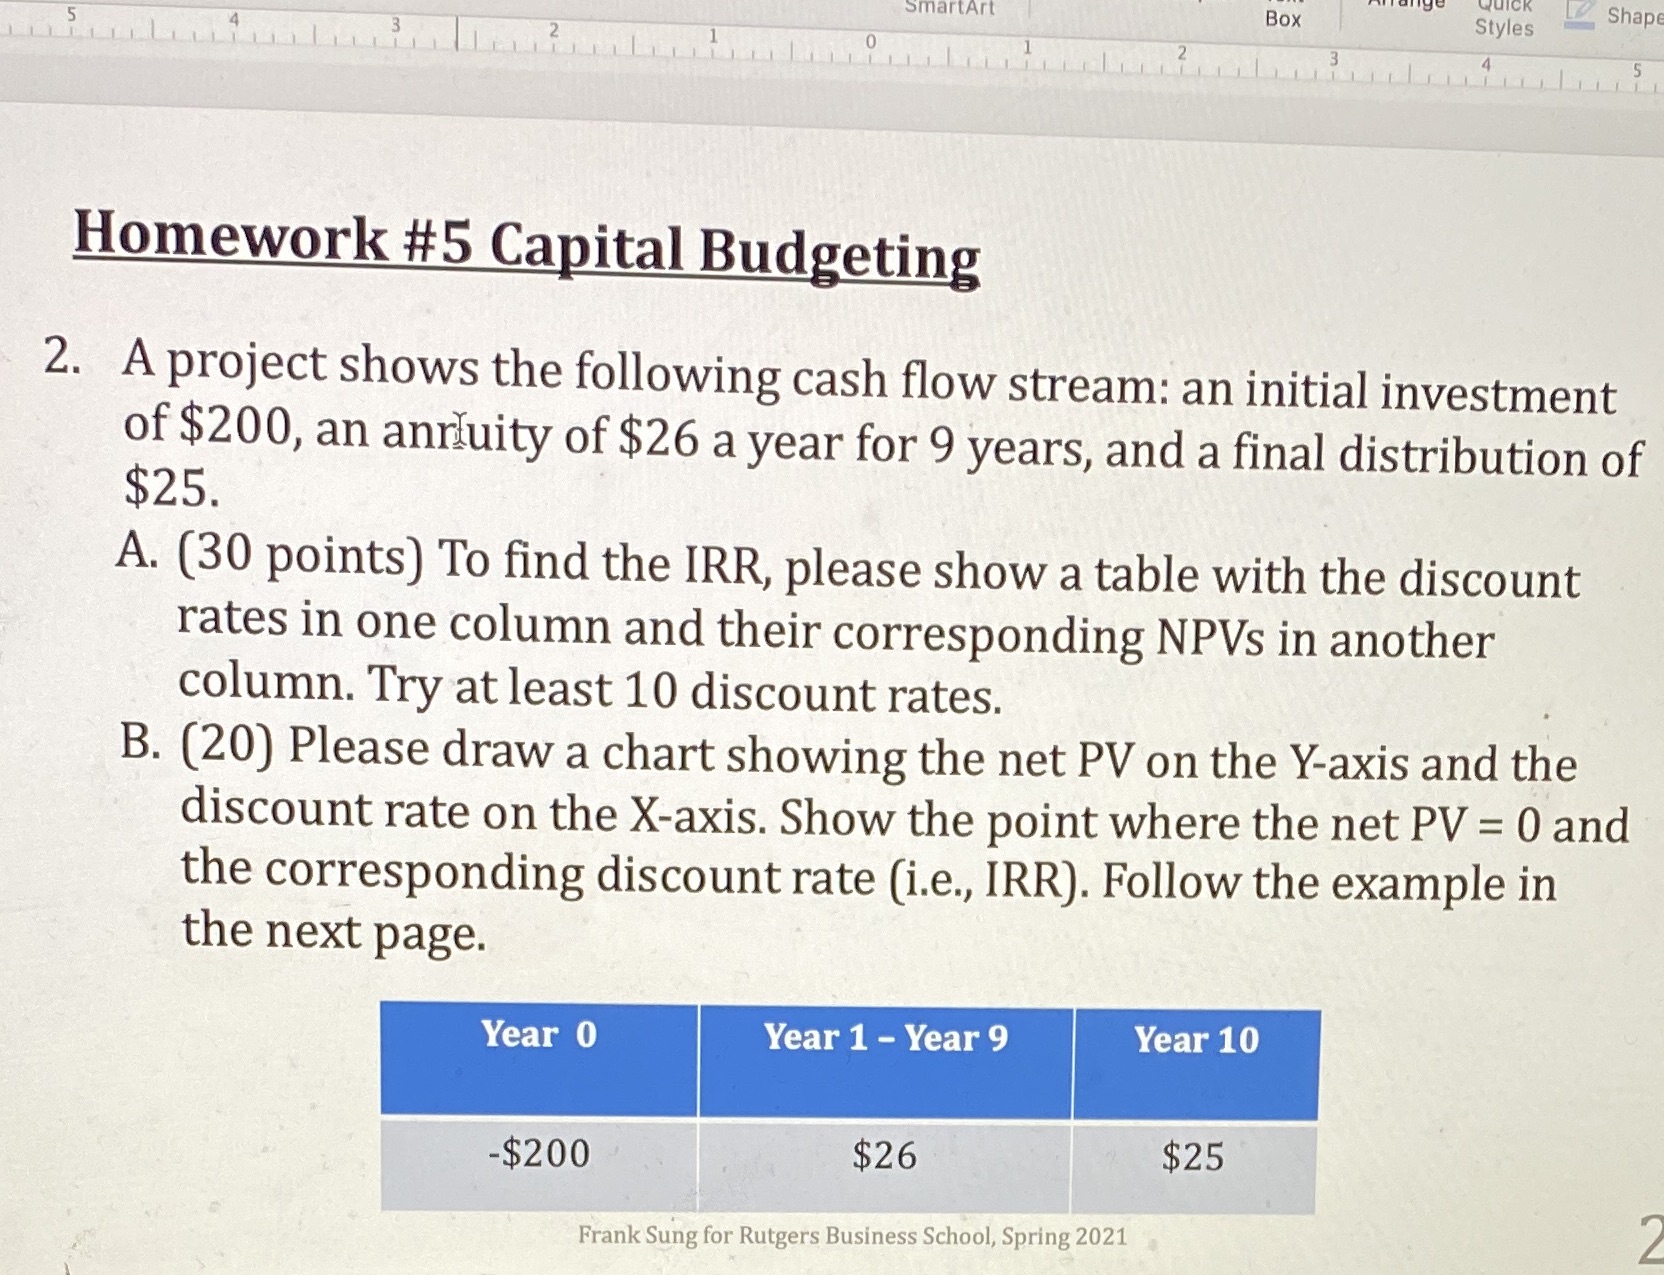
Question: The graph will be separated for the question B please look at the graph SmartArt Box Styles Shape Homework #5 Capital Budgeting 2. A project

The graph will be separated for the question B please look at the graph

The graph will be separated for the question B
SmartArt Box Styles Shape Homework #5 Capital Budgeting 2. A project shows the following cash flow stream: an initial investment of $200, an annuity of $26 a year for 9 years, and a final distribution of $25. A. (30 points) To find the IRR, please show a table with the discount rates in one column and their corresponding NPVs in another column. Try at least 10 discount rates. B. (20) Please draw a chart showing the net PV on the Y-axis and the discount rate on the X-axis. Show the point where the net PV = 0 and the corresponding discount rate (i.e., IRR). Follow the example in the next page. Year 0 Year 1 - Year 9 Year 10 -$200 $26 $25 Frank Sung for Rutgers Business School, Spring 2021

Step by Step Solution

There are 3 Steps involved in it

1 Expert Approved Answer
Step: 1 Unlock blur-text-image
Question Has Been Solved by an Expert!

Get step-by-step solutions from verified subject matter experts

Step: 2 Unlock
Step: 3 Unlock

Students Have Also Explored These Related Accounting Questions!