

Question: The graphic best represents a ( n ) q , SStrategic group map SWOT anaylsis chart ESTEL analysis chart Porter's five forces analysis chart
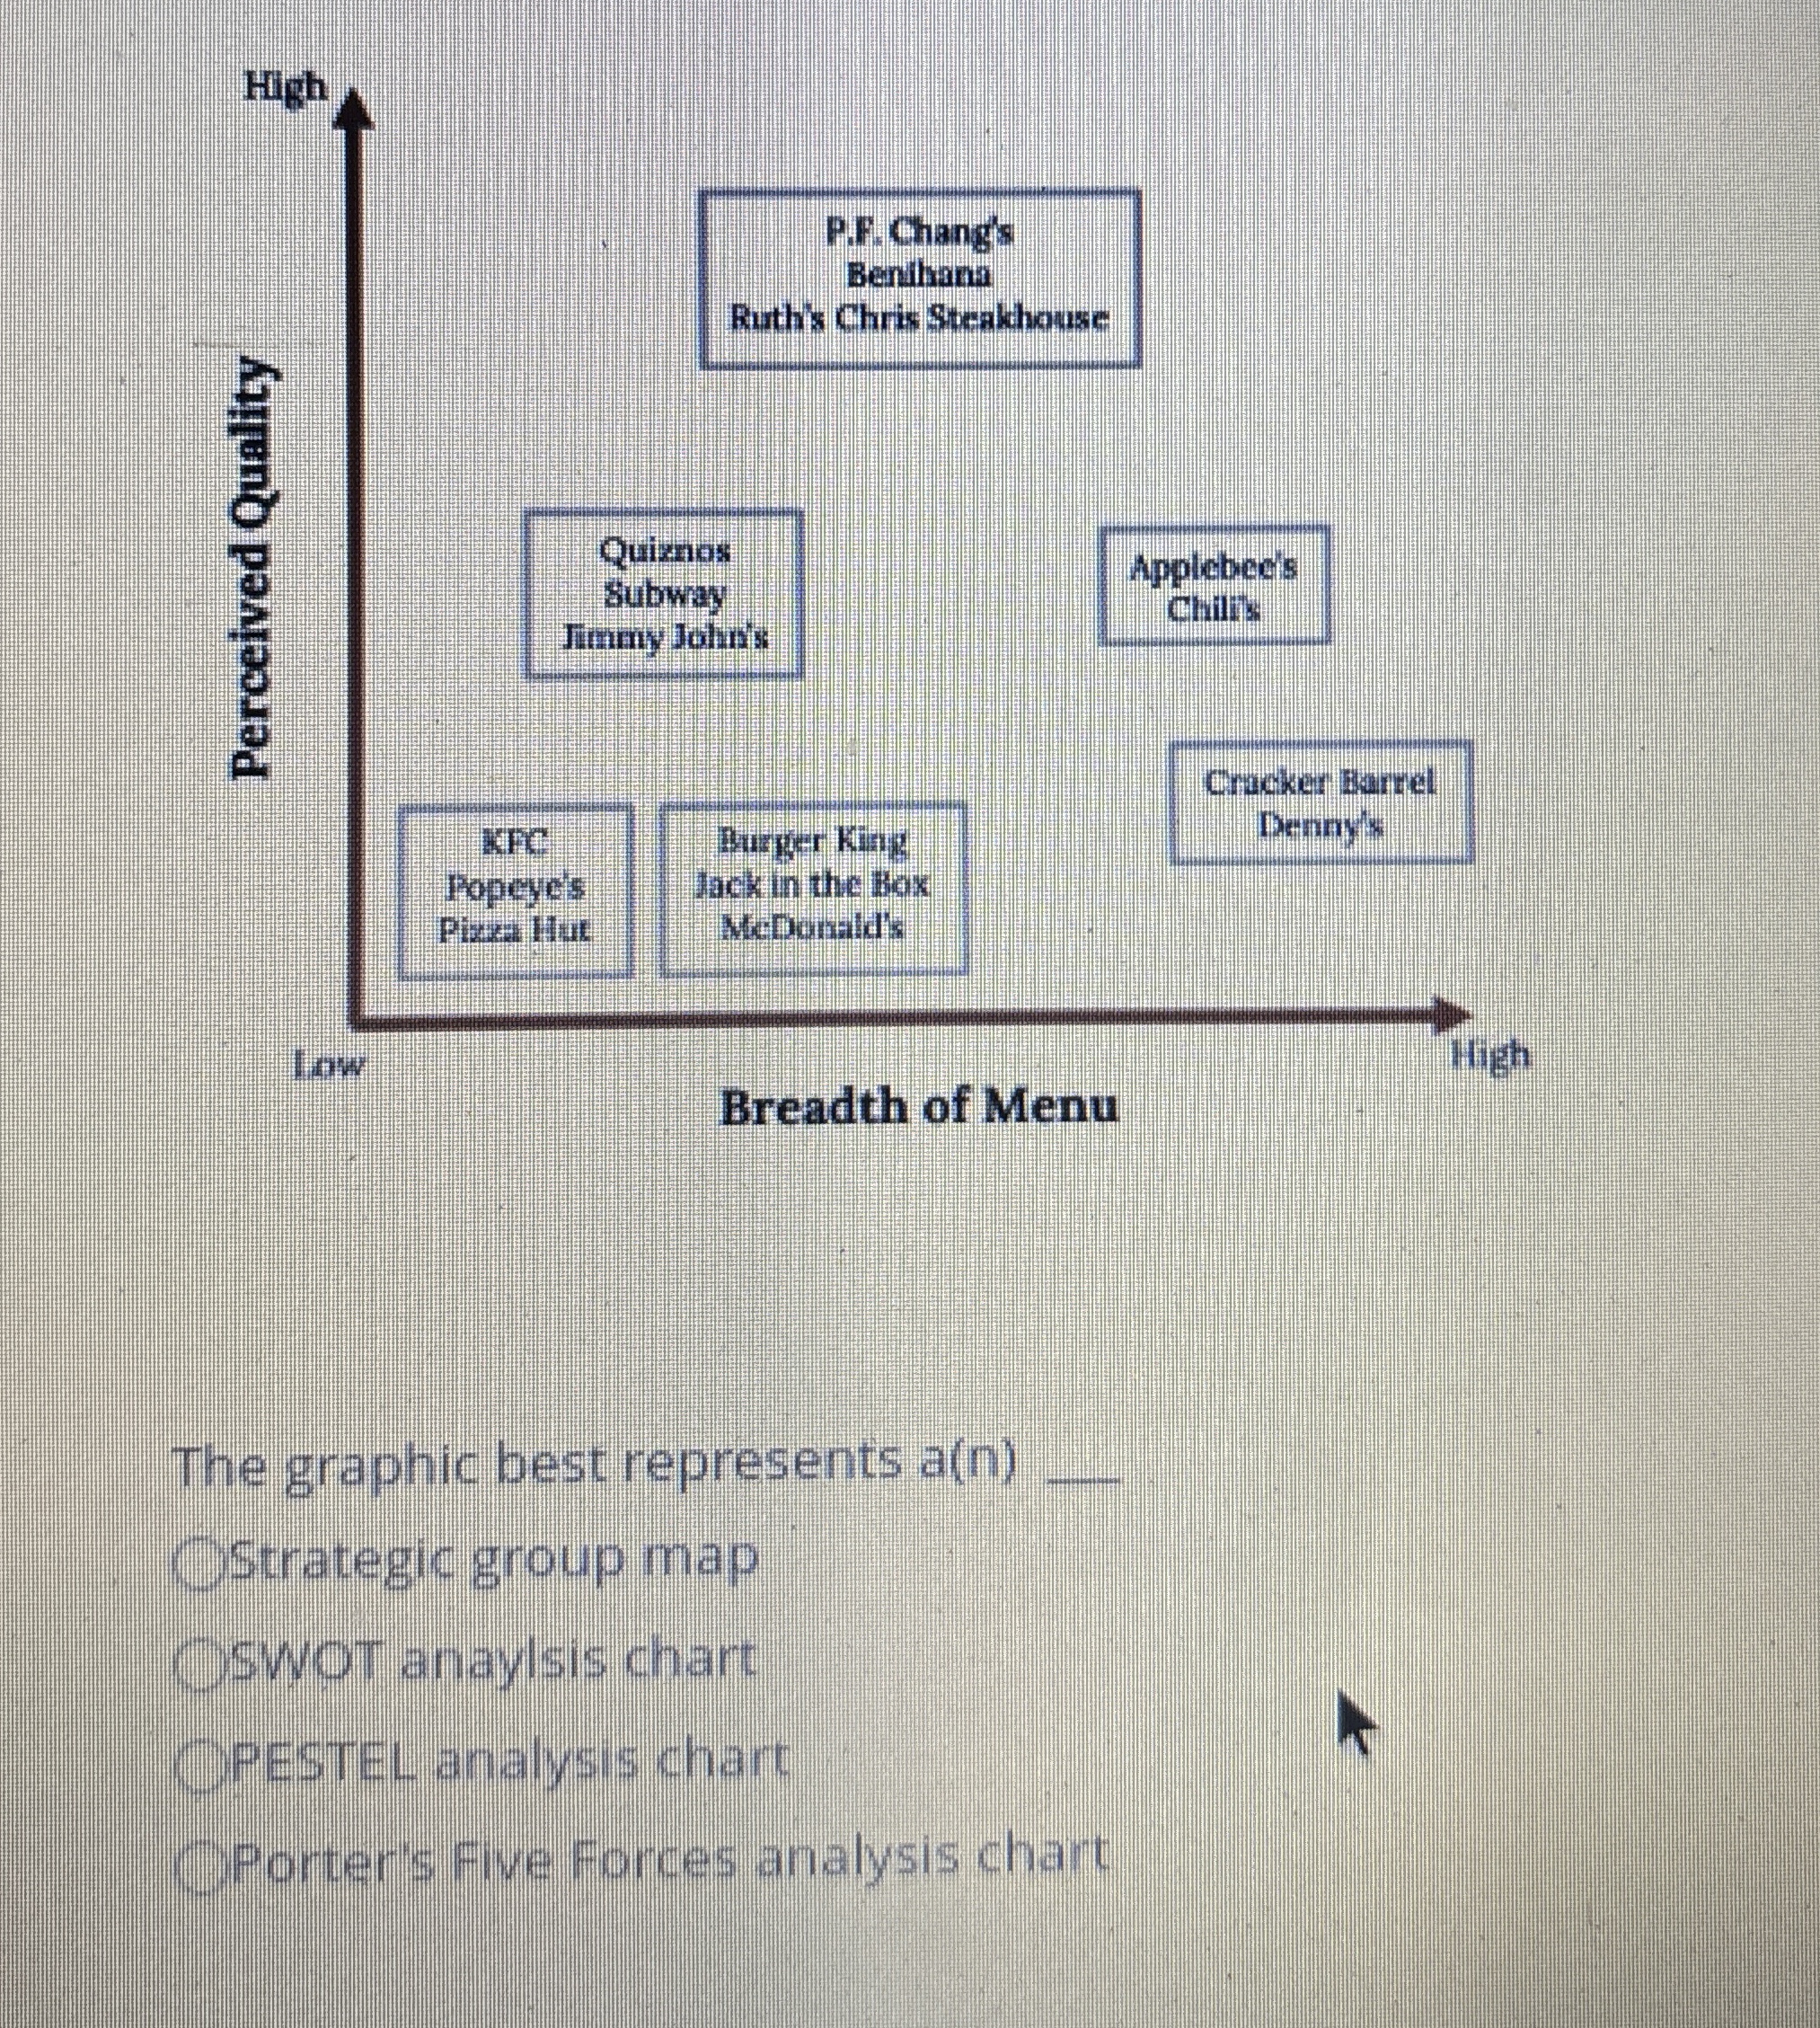
The graphic best represents an
SStrategic group map
SWOT anaylsis chart
ESTEL analysis chart
Porter's five forces analysis chart
Step by Step Solution
There are 3 Steps involved in it
1 Expert Approved Answer
Step: 1 Unlock

Question Has Been Solved by an Expert!
Get step-by-step solutions from verified subject matter experts
Step: 2 Unlock
Step: 3 Unlock