

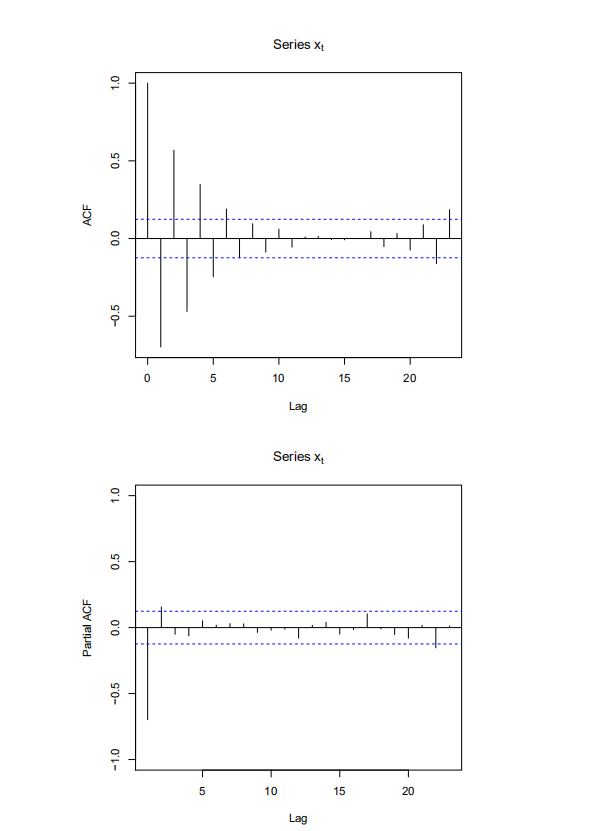
Question: The graphs below show the sample autocorrelations and sample partial autocor relations of an observed time series, {xt} . Based on these graphs, what models
The graphs below show the sample autocorrelations and sample partial autocor
relations of an observed time series, {xt}. Based on these graphs, what models would
you consider for {xt}? Which model would be your fifirst choice? (Justify your answers
concisely.)
\f
Step by Step Solution
There are 3 Steps involved in it
1 Expert Approved Answer
Step: 1 Unlock

Question Has Been Solved by an Expert!
Get step-by-step solutions from verified subject matter experts
Step: 2 Unlock
Step: 3 Unlock