

Question: The graphs given below show how the water / cement ratio affects the hardened 1 ] : The graphs given below show how the water
The graphs given below show how the watercement ratio affects the hardened
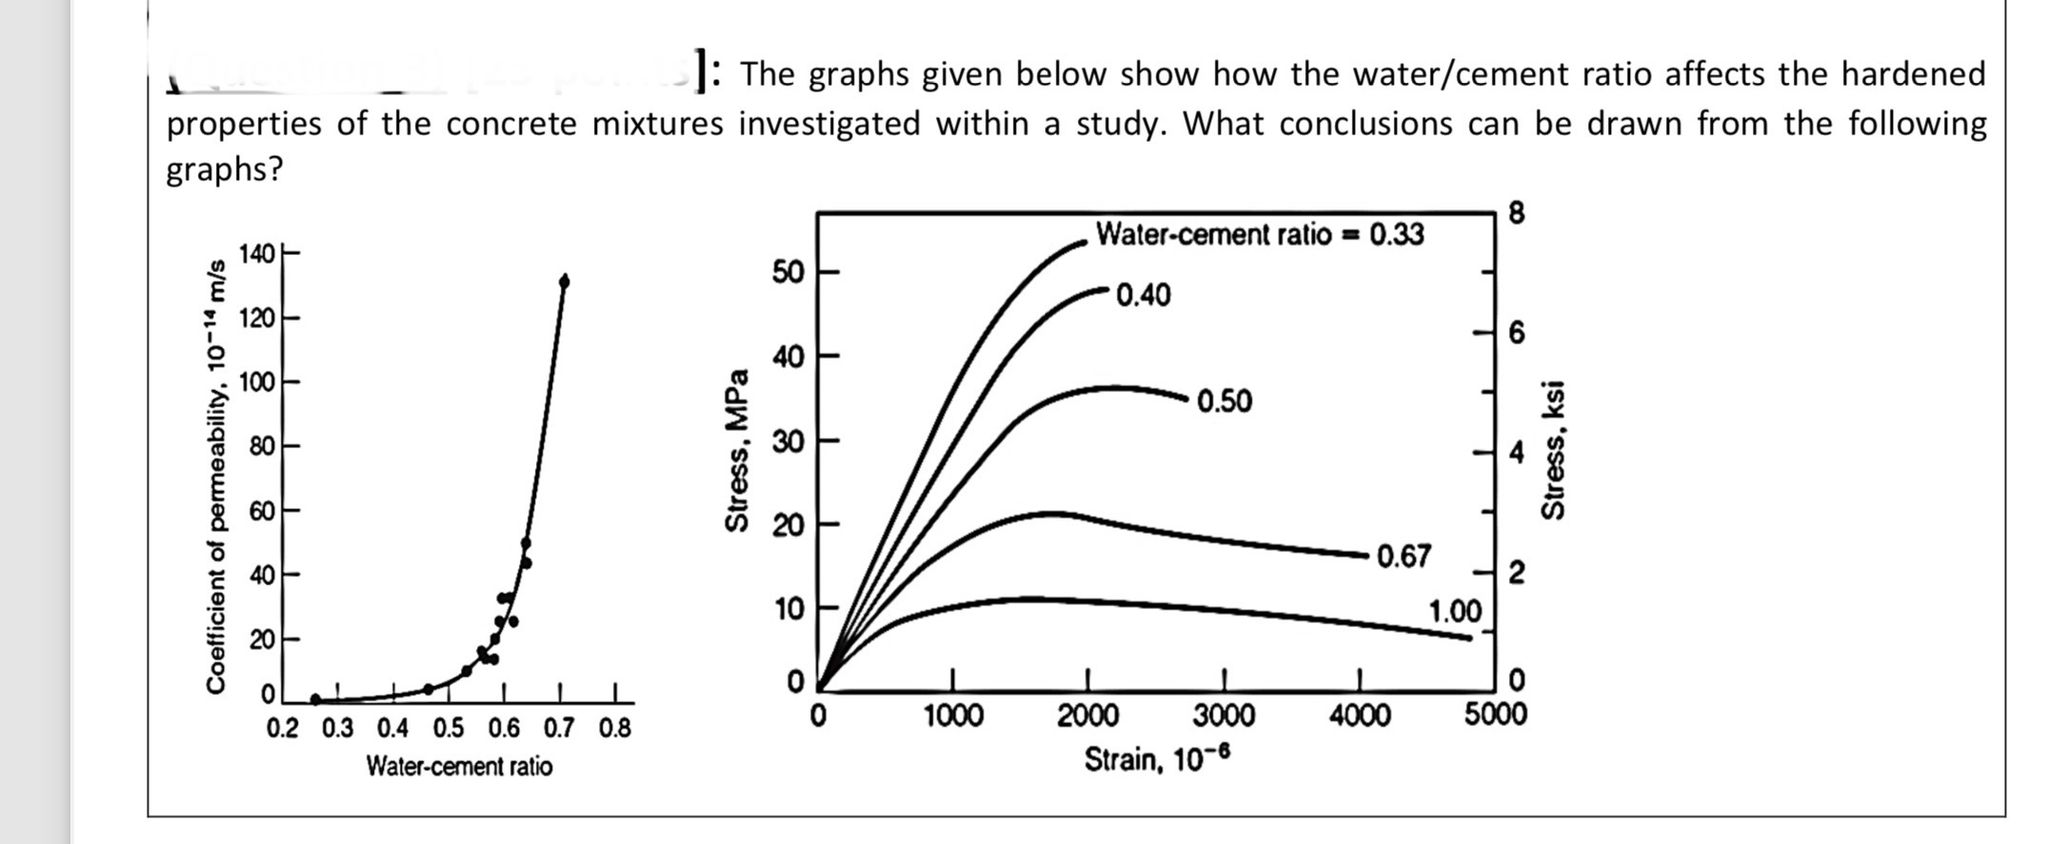
: The graphs given below show how the watercement ratio affects the hardened
properties of the concrete mixtures investigated within a study. What conclusions can be drawn from the following
graphs?
properties of the concrete mixtures investigated within a study. What conclusions can be drawn from the following
graphs?
Step by Step Solution
There are 3 Steps involved in it
1 Expert Approved Answer
Step: 1 Unlock

Question Has Been Solved by an Expert!
Get step-by-step solutions from verified subject matter experts
Step: 2 Unlock
Step: 3 Unlock