

Question: The graphs representing typical engineering stress vs . engineering strain curves for four different polymers in a tensile test is presented below. For each polymer,
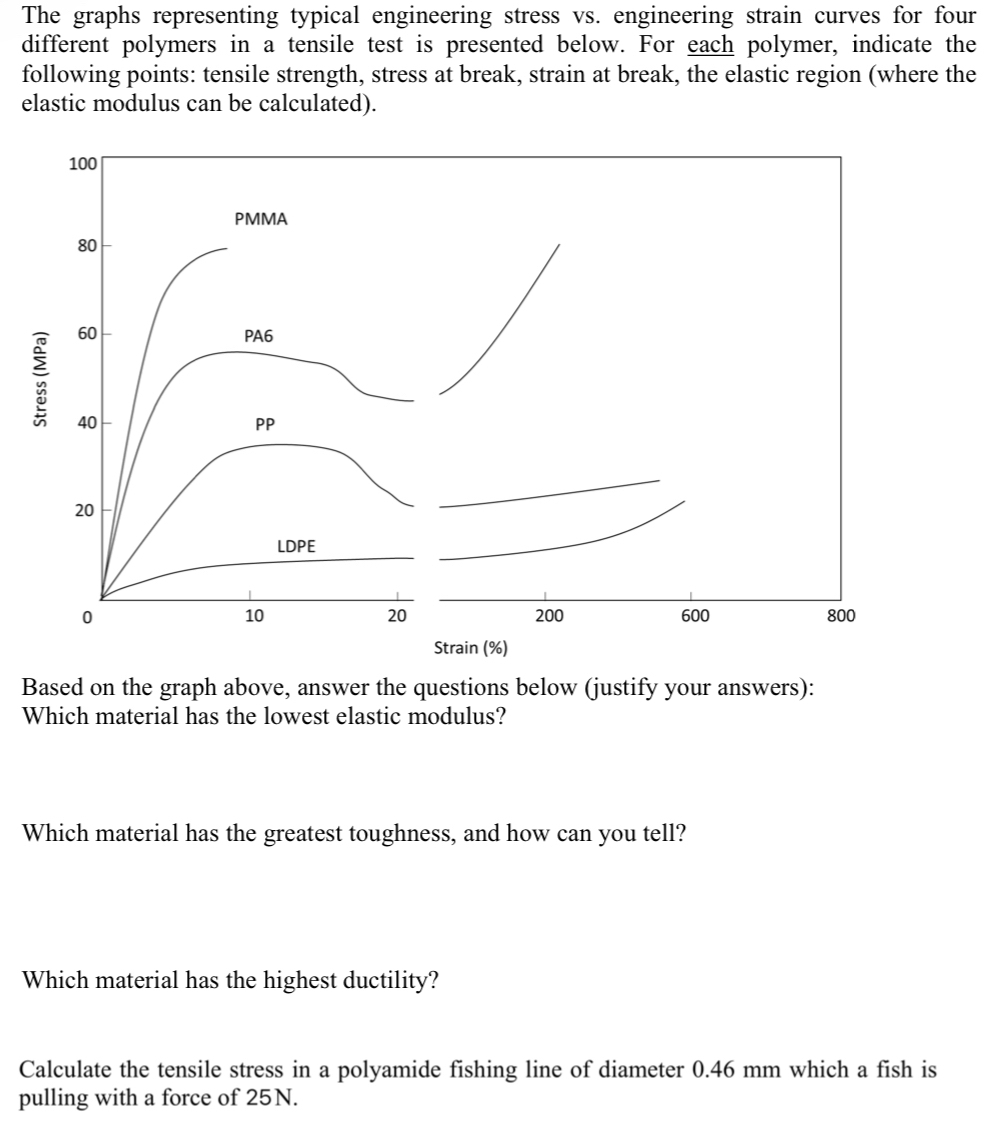
The graphs representing typical engineering stress vs engineering strain curves for four different polymers in a tensile test is presented below. For each polymer, indicate the following points: tensile strength, stress at break, strain at break, the elastic region where the elastic modulus can be calculated
Based on the graph above, answer the questions below justify your answers: Which material has the lowest elastic modulus?
Which material has the greatest toughness, and how can you tell?
Which material has the highest ductility?
Calculate the tensile stress in a polyamide fishing line of diameter mm which a fish is pulling with a force of N
Step by Step Solution
There are 3 Steps involved in it
1 Expert Approved Answer
Step: 1 Unlock

Question Has Been Solved by an Expert!
Get step-by-step solutions from verified subject matter experts
Step: 2 Unlock
Step: 3 Unlock