

Question: The green chart is Table 6.2 Go to the Excel spreadsheet versions of Table 6.2 to answer the following questions. (Do not round intermediate calculations.
The green chart is Table 6.2
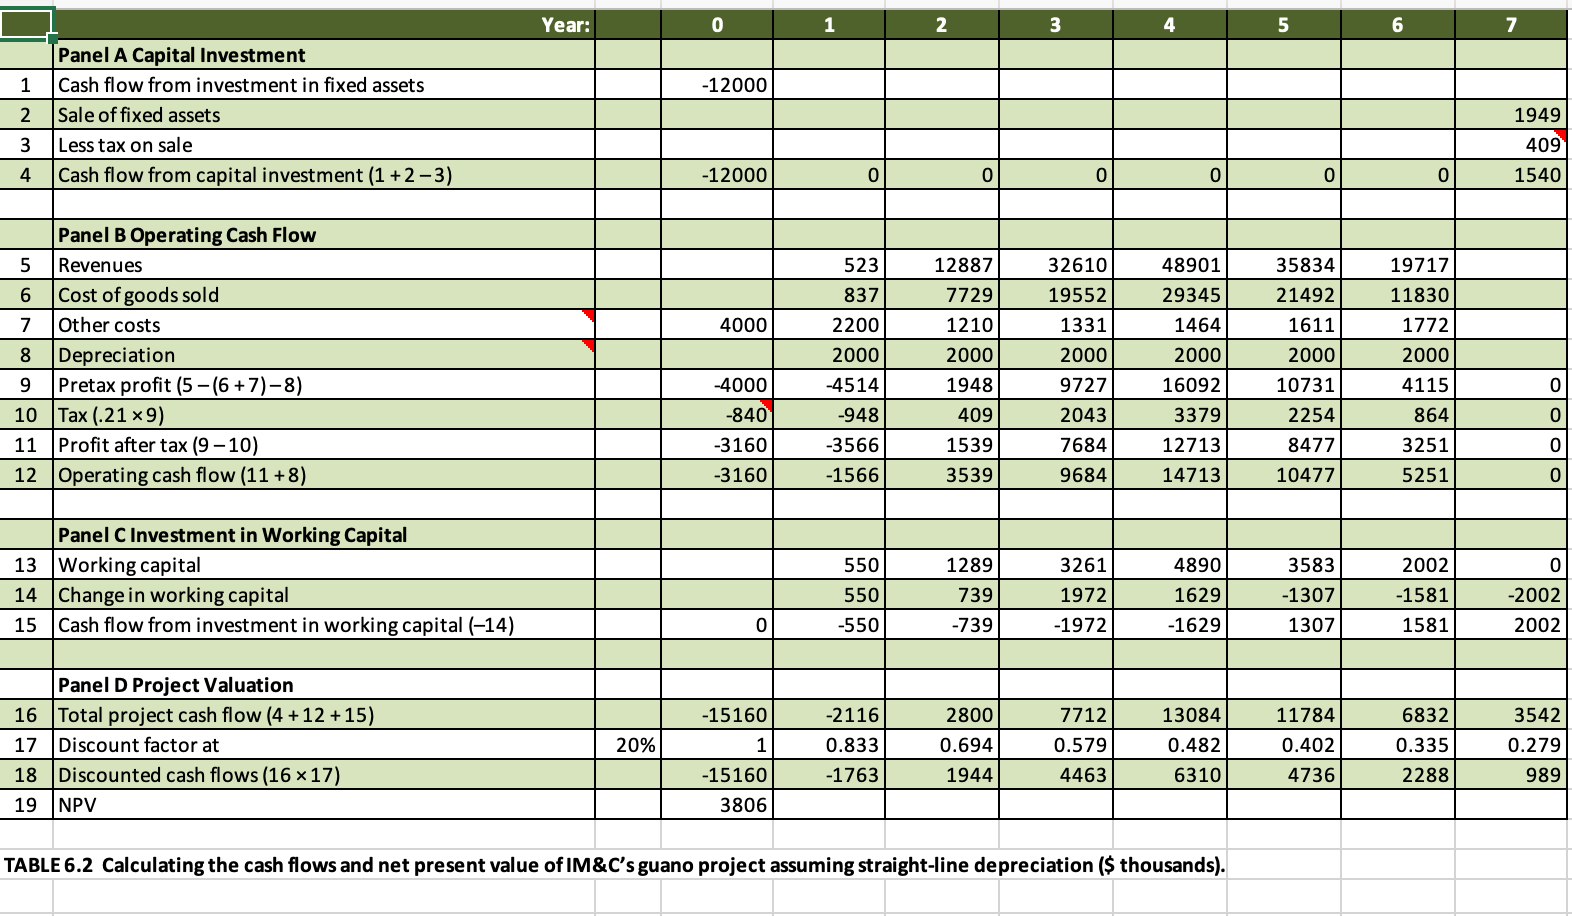
Go to the Excel spreadsheet versions of Table 6.2 to answer the following questions. (Do not round intermediate calculations. Enter your answers in thousands rounded to the nearest whole number.) a. New engineering estimates raise the possibility that capital investment will be more than $12 million, perhaps as much as $15 million. On the other hand, you believe that the 20% cost of capital is unrealistically high and that the true cost of capital is about 11%. Assume straight line depreciation. Calculate the NPV under these alternative assumptions. NPV b. Continue with the assumed $15 million capital investment and the 11% cost of capital. What if sales, cost of goods sold, and net working capital are each 10% higher in every year? Assume straight line depreciation. Calculate the NPV based on these assumptions. NPV Year: 0 6 7 -12000 1 2 3 4 Panel A Capital Investment Cash flow from investment in fixed assets Sale of fixed assets Less tax on sale Cash flow from capital investment (1 +2 -3) 1949 409 1540 -12000 + 4000 Panel B Operating Cash Flow 5 Revenues 6 Cost of goods sold 7 Other costs 8 Depreciation 9 Pretax profit (5-(6 + 7)-8) 10 Tax (.21 ~9) 11 Profit after tax (9-10) 12 Operating cash flow (11 +8) 5231288732610 837 7729 19552 2200 1210 1331 2000 2000 2000 -4514 1948 9727 -948 409 2043 -3566 1539 7684 -1566 3539 9684 48901 29345 1464 2000 16092 3379 12713 14713 35834) 21492 1611 2000 10731 2254 8477 10477 19717 11830 1772 2000 4115 864 3251 5251 -4000 -840 -3160 -3160 0 1 550 0 1 Panel C Investment in Working Capital 13 Working capital 14 Change in working capital 15 Cash flow from investment in working capital (-14) 550 1289 739 -739 3261 1972 -1972 4890 1629 -1629 3583 -1307 1307 2002 -1581 1581 -2002 2002 -550 -15160 Panel D Project Valuation 16 Total project cash flow (4 +12 +15) 17 Discount factor at 18 Discounted cash flows (16 x 17) 19 NPV T 20% -2116 0.833 -1763 2800 0.694 1944) 7712 0.579 4463 1 3084 0.482 6310 11784 0.402 4736 6832 0.335 2288 3542| 0.279 989 -15160 3806 TABLE 6.2 Calculating the cash flows and net present value of IM&C's guano project assuming straight-line depreciation ($ thousands)
Step by Step Solution
There are 3 Steps involved in it

Get step-by-step solutions from verified subject matter experts