

Question: The G-theory table below is from a study in which elementary school students were each required to complete 5 science tasks (e.g., conducting tests or
The G-theory table below is from a study in which elementary school students were each required to complete 5 science tasks (e.g., conducting tests or experiments, filling in tables, etc.) which were rated by three teachers. Each of the 5 tasks was rated by each of the 3 teachers, for all the students.
A) What are the facets of measurement?
B) Would the facets in this design to be random or fixed?Explain.
C) Officials at the school from which the data was taken need to choose their top science student to represent the school at the state science fair.Should they use a relative (g coefficient) or absolute coefficient (phi coefficient)? Explain the answer.
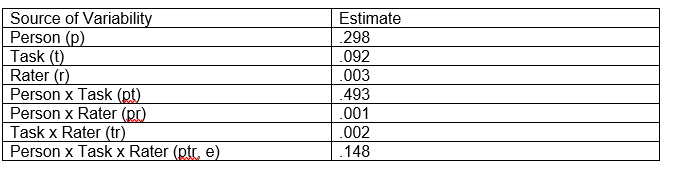
Source of Variability Estimate Person (p) 298 Task (t) 092 Rater (0) 003 Person x Task (pt) 493 Person x Rater (pr) 001 Task x Rater (tr) 002 Person x Task x Rater (ptr, e) 148
Step by Step Solution
There are 3 Steps involved in it

Get step-by-step solutions from verified subject matter experts