

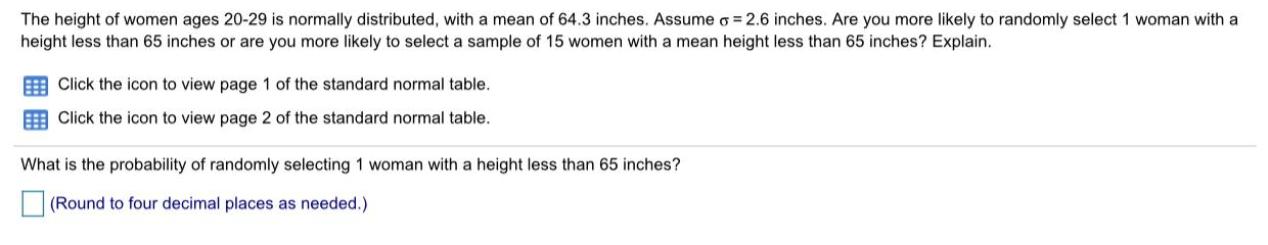
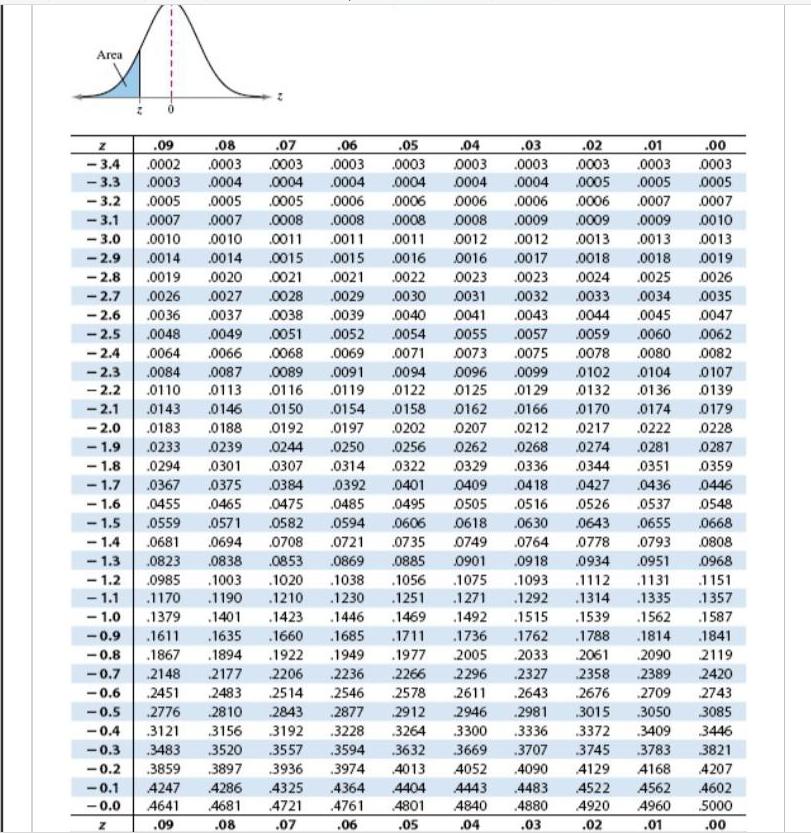
The height of women ages 20-29 is normally distributed, with a mean of 64.3 inches. Assume...
Fantastic news! We've Found the answer you've been seeking!
Question:
Transcribed Image Text:
The height of women ages 20-29 is normally distributed, with a mean of 64.3 inches. Assume o = 2.6 inches. Are you more likely to randomly select 1 woman with a height less than 65 inches or are you more likely to select a sample of 15 women with a mean height less than 65 inches? Explain. E Click the icon to view page 1 of the standard normal table. Click the icon to view page 2 of the standard normal table. What is the probability of randomly selecting 1 woman with a height less than 65 inches? (Round to four decimal places as needed.) Area .09 - 3.4 .0002 - 3.3 08 .07 .06 .05 04 .03 02 .01 .00 .0003 .0003 .0003 .0003 0003 .0003 .0003 .0003 0003 .0003 0004 .0004 .0004 0004 0004 .0004 0005 .0005 0005 - 3.2 .0005 .0005 .0005 .0006 .0006 0006 .0006 0006 .0007 0007 .0007 .0007 .0010 0010 - 3.1 .0008 .0008 .0008 0008 .0009 .0009 .0009 0010 - 3.0 -2.9 - 2.8 - 2.7 - 2.6 - 2.5 .0011 .0011 .0011 0012 .0012 0013 .0013 0013 .0014 .0014 .0015 .0015 .00 16 0016 .0017 0018 .0018 0019 .0019 0020 0022 0023 0024 0025 .0034 .0021 .0021 .0023 0026 .0026 .0027 0028 .0029 .0030 0031 .0032 0033 0035 0036 0037 0038 .0039 .0040 0041 .0043 0044 .0045 0047 .0048 .0049 .0051 .0052 0054 0055 .0057 .0059 .0060 0062 -2.4 .0064 0066 .0068 .0069 .0071 0073 .0075 0078 .0080 0082 - 2.3 - 2.2 0084 .0087 0113 .0089 0091 .0094 0096 .0099 0102 0104 0107 0110 .0116 .0119 0122 0125 .0129 0132 .0136 0139 - 2.1 .0143 0146 .0150 .0154 0158 0162 0166 0170 .0174 0179 - 2.0 .0183 0188 0192 .0197 .0202 0207 .0212 0217 .0222 0228 -1.9 0256 .0233 - 1.8 0294 - 1.7 0367 - 1.6 0239 0244 .0250 0262 .0268 0274 .0281 0287 0301 0307 .0314 .0322 0329 .0336 0344 .0351 0359 0375 0384 0392 0401 0409 .0418 .0427 .0436 0446 .0455 .0465 0475 .0485 .0495 0505 .05 16 .0526 .0537 0548 -1.5 .0559 0571 0582 .0594 0606 0618 .0630 0643 .0655 0668 - 1.4 0681 -1.30823 - 1.2 0985 .1003 .1170 .0694 0708 .0721 0735 0749 .0764 0778 .0793 0808 .0838 .0853 .0869 0885 0901 .0918 0934 .0951 0968 .1020 .1038 .1056 .1075 .1093 .1112 .1131 1151 - 1.1 - 1.0 1379 .1190 .1210 .1230 .1251 .1271 1292 .1314 .1335 1357 .1401 .1423 .1446 1469 .1492 .1515 .1539 .1562 .1587 1635 1788 .1814 2090 -0.9 .1611 .1660 .1685 .1711 .1736 .1762 .1841 -0.8 .1867 .1894 .1922 .1949 .1977 2005 2033 2061 2119 -0.7 2148 2177 2206 2236 2266 2296 .2327 2358 2389 2420 -0.6 2451 2483 2776 2810 2843 2877 2514 .2546 2578 2611 2643 2676 2709 2743 - 0.5 2912 2946 2981 3015 3050 3085 3409 3783 -0.4 3121 3156 3192 .3228 3264 3300 3336 3372 3446 -0.3 3483 3520 3557 3594 3632 3669 3707 3745 3821 -0.2 3859 3897 3936 3974 4013 4052 4090 4129 A168 4207 -0.1 4247 4286 4325 4364 4404 4443 4483 4522 A562 4602 - 0.0 A641 4681 4721 4761 4801 4840 4880 4920 4960 5000 .09 .08 .07 .06 .05 .04 .03 .02 .01 .00 The height of women ages 20-29 is normally distributed, with a mean of 64.3 inches. Assume o = 2.6 inches. Are you more likely to randomly select 1 woman with a height less than 65 inches or are you more likely to select a sample of 15 women with a mean height less than 65 inches? Explain. E Click the icon to view page 1 of the standard normal table. Click the icon to view page 2 of the standard normal table. What is the probability of randomly selecting 1 woman with a height less than 65 inches? (Round to four decimal places as needed.) Area .09 - 3.4 .0002 - 3.3 08 .07 .06 .05 04 .03 02 .01 .00 .0003 .0003 .0003 .0003 0003 .0003 .0003 .0003 0003 .0003 0004 .0004 .0004 0004 0004 .0004 0005 .0005 0005 - 3.2 .0005 .0005 .0005 .0006 .0006 0006 .0006 0006 .0007 0007 .0007 .0007 .0010 0010 - 3.1 .0008 .0008 .0008 0008 .0009 .0009 .0009 0010 - 3.0 -2.9 - 2.8 - 2.7 - 2.6 - 2.5 .0011 .0011 .0011 0012 .0012 0013 .0013 0013 .0014 .0014 .0015 .0015 .00 16 0016 .0017 0018 .0018 0019 .0019 0020 0022 0023 0024 0025 .0034 .0021 .0021 .0023 0026 .0026 .0027 0028 .0029 .0030 0031 .0032 0033 0035 0036 0037 0038 .0039 .0040 0041 .0043 0044 .0045 0047 .0048 .0049 .0051 .0052 0054 0055 .0057 .0059 .0060 0062 -2.4 .0064 0066 .0068 .0069 .0071 0073 .0075 0078 .0080 0082 - 2.3 - 2.2 0084 .0087 0113 .0089 0091 .0094 0096 .0099 0102 0104 0107 0110 .0116 .0119 0122 0125 .0129 0132 .0136 0139 - 2.1 .0143 0146 .0150 .0154 0158 0162 0166 0170 .0174 0179 - 2.0 .0183 0188 0192 .0197 .0202 0207 .0212 0217 .0222 0228 -1.9 0256 .0233 - 1.8 0294 - 1.7 0367 - 1.6 0239 0244 .0250 0262 .0268 0274 .0281 0287 0301 0307 .0314 .0322 0329 .0336 0344 .0351 0359 0375 0384 0392 0401 0409 .0418 .0427 .0436 0446 .0455 .0465 0475 .0485 .0495 0505 .05 16 .0526 .0537 0548 -1.5 .0559 0571 0582 .0594 0606 0618 .0630 0643 .0655 0668 - 1.4 0681 -1.30823 - 1.2 0985 .1003 .1170 .0694 0708 .0721 0735 0749 .0764 0778 .0793 0808 .0838 .0853 .0869 0885 0901 .0918 0934 .0951 0968 .1020 .1038 .1056 .1075 .1093 .1112 .1131 1151 - 1.1 - 1.0 1379 .1190 .1210 .1230 .1251 .1271 1292 .1314 .1335 1357 .1401 .1423 .1446 1469 .1492 .1515 .1539 .1562 .1587 1635 1788 .1814 2090 -0.9 .1611 .1660 .1685 .1711 .1736 .1762 .1841 -0.8 .1867 .1894 .1922 .1949 .1977 2005 2033 2061 2119 -0.7 2148 2177 2206 2236 2266 2296 .2327 2358 2389 2420 -0.6 2451 2483 2776 2810 2843 2877 2514 .2546 2578 2611 2643 2676 2709 2743 - 0.5 2912 2946 2981 3015 3050 3085 3409 3783 -0.4 3121 3156 3192 .3228 3264 3300 3336 3372 3446 -0.3 3483 3520 3557 3594 3632 3669 3707 3745 3821 -0.2 3859 3897 3936 3974 4013 4052 4090 4129 A168 4207 -0.1 4247 4286 4325 4364 4404 4443 4483 4522 A562 4602 - 0.0 A641 4681 4721 4761 4801 4840 4880 4920 4960 5000 .09 .08 .07 .06 .05 .04 .03 .02 .01 .00
Expert Answer:

Related Book For 

Posted Date:
Students also viewed these mathematics questions
-
Assume X is normally distributed with a mean of 10 and a standard deviation of 2. Determine the following: (a) P(X < 13) (b) P(X > 9) (c) P(6 < X < 14) (d) P(2 < X < 4) (e) P(-2 < X < 8)
-
A random variable X is normally distributed with a mean of 100 and a variance of 100 and a random variable Y is normally distributed with a mean of 200 and a variance of 400. The random variables...
-
A random variable X is normally distributed with a mean of 100 and a variance of 100, and a random variable Y is normally distributed with a mean of 200 and a variance of 400. The random variables...
-
GoFast Corp. wishes to renovate the property so that he can sell it at a higher price.The after-tax cash flow over next year up to RM320,000 if the property was renovated.The renovation cost is...
-
This problem asks you to analyze the ISLM model algebraically. Suppose consumption is a linear function of disposable income: C(Y T) = a + b(Y T), where a > 0 and 0 < b < 1. Suppose also that...
-
Daniel Grady is the financial advisor for a number of professional athletes. An analysis of the long-term goals for many of these athletes has resulted in a recommendation to purchase stocks with...
-
In 1940, the family of Thomas Back entered into an oil-and-gas lease with the Inland Gas Corporation. The lease held that Inland would pay to Backs family 12 cents per thousand cubic feet of gas...
-
Arquitectos Interiores of Juarez, Mexico, is contemplating a major change in its cost structure. Currently, all of its drafting work is performed by skilled draftsmen. Alfonso Jiminez, Arquitectos...
-
2. Consider the variation of hot-potato routing/coordination routing game discussed in class, where there are three strategies: Payoff Hot Potato Long Path Planned Long-Path | Planned Hot Potato...
-
The Mac Davis Company specializes in the purchase, renovation, and resale of older homes. Mac employs several carpenters and painters to do the work for him. It is essential for him to have accurate...
-
4. What is the magnitude of your displacement when you follow directions that tell you to walk 225 m in one direction, make a 90 turn to the left and walk 350 m, then make a 30 turn to the right and...
-
Two heaters A and B are in parallel across supply voltage V . Heater A produces 5 0 0 kcal in 2 0 0 min and B produces 1 0 0 0 kcal in 1 0 min. The resistance of A is 1 0 ohms. What is the resistance...
-
7. Northwest Natural Holding (NWN) paid $1.93 dividend in the past year (2021). a. Analysts expect its annual dividend to be $2.00 in the next year and then the dividend growth rate will be 3% per...
-
In a local boutique, you intend to buy a handbag with an original price of $38, a jacket with an original price of $189, and a scarf with an original price of $23. Currently, the store is running a...
-
Suppose you wish to buy a house costing $4000000. You will put a down payment of 60% of the purchase price and borrow the rest from a bank for 30 years at a fixed annual interest rate r. If you wish...
-
During the year just ended, Honeyblue Corp. incurred costs to develop and produce a routine, low-risk computer software product as follows: Completion of detail program design $13,000 Costs incurred...
-
Tender must occur at a reasonable hour and in a reasonable manner. Amazon delivers a shipment of 1 0 0 0 frozen dinners at 2 am to the Warehouse that Fit - for - life addressed for delivery. Upon...
-
Gopher, Inc. developing its upcoming budgeted Costs of Quality (COQ) with the following information: Expense Item Budget Raw Materials Inspection $ 15,000 EPA Fine 200,000 Design Engineering 15,000...
-
In March 1995, The Harris Poll reported that 80% of parents spank their children. Suppose a recent poll of 1030 adult Americans with children nds that 781 indicated that they spank their children. If...
-
Using the data in Problem 25, what percentage of California community colleges have tuition below $800? What percentage of California community colleges have tuition of $850 or more? Tuition...
-
Researchers conducted an experiment to determine the effectiveness of a commercial caffeinated carbohydrateelectrolyte sports drink compared with aplacebo. Sixteen highly trained cyclists each...
-
(a) The longitudinal data set "v4c" is in the vertical format; transform it into the horizontal format. (b) Transform the data set you obtained in part (a) back into the vertical format.
-
Perform some exploratory analysis on the DTS study described above. (a) Compute the mean and standard deviation of the HamD scores for the two treatment groups at each time point. (b) Treat repeated...
-
Plot the mean/SD of HIV knowledge of adolescent girls at baseline and three months post treatment stratified by treatment for the Sexual Health study.

Study smarter with the SolutionInn App