

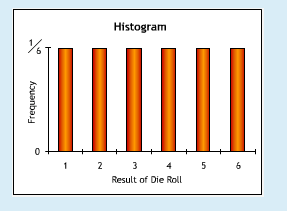
Question: The histogram below shows the underlying distribution pattern of the results of a rolled die. Suppose the die is rolled 50 times and the results
The histogram below shows the underlying distribution pattern of the results of a rolled die. Suppose the die is rolled 50 times and the results are averaged. Suppose this process - rolling 50 dice and averaging their results - is repeated 100 times.
Which of the following best describes the distribution of these 100 averages?
Select one:
a. Skewed right.
b. Skewed left.
c. Normal.
d. Uniform.
\f
Step by Step Solution
There are 3 Steps involved in it
1 Expert Approved Answer
Step: 1 Unlock

Question Has Been Solved by an Expert!
Get step-by-step solutions from verified subject matter experts
Step: 2 Unlock
Step: 3 Unlock