

Question: The histogram in the figure below is based on information from one university survey. The histogram displays hours of sleep per day for a random
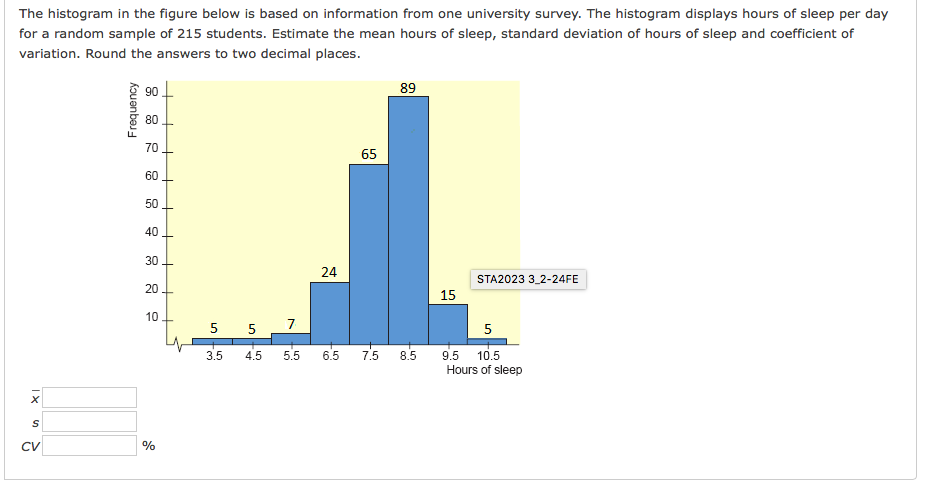

The histogram in the figure below is based on information from one university survey. The histogram displays hours of sleep per day for a random sample of 215 students. Estimate the mean hours of sleep, standard deviation of hours of sleep and coefficient of variation. Round the answers to two decimal places. 89 90 Frequency 80 70 65 60 50 40 30 24 STA2023 3_2-24FE 20 15 10 5 5 7. 5 3.5 4.5 5.5 6.5 7.5 8.5 9.5 10.5 Hours of sleep CV %
Step by Step Solution
There are 3 Steps involved in it
1 Expert Approved Answer
Step: 1 Unlock

Question Has Been Solved by an Expert!
Get step-by-step solutions from verified subject matter experts
Step: 2 Unlock
Step: 3 Unlock