

Question: The histogram shown below relates to a study undertaken by Baker et al. (2003) of the impact of roster changes on absenteeism and incident frequency
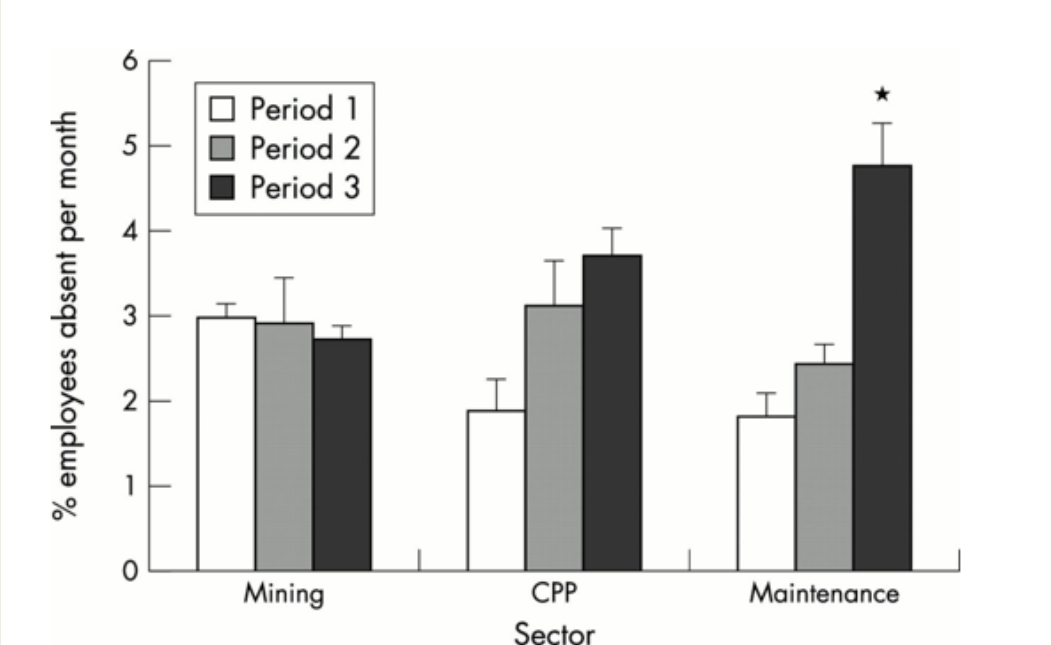
The histogram shown below relates to a study undertaken by Baker et al. (2003) of the impact of roster changes on absenteeism and incident frequency in an Australian coal mine. The average monthly absenteeism rates in thethree specific work areas examined, according to collectionperiod. The authors state that 'there was a trend for increased rates during the second (3.11%) and third (3.72%) collection periods within the CPP sector, compared to the first (1.87%),F(2,24) = 2.441,p> 0.05.' What does this result explain?
\f
Step by Step Solution
There are 3 Steps involved in it
1 Expert Approved Answer
Step: 1 Unlock

Question Has Been Solved by an Expert!
Get step-by-step solutions from verified subject matter experts
Step: 2 Unlock
Step: 3 Unlock