

Question: The image below is from SPSS. What does this chart say about my data? My hypothesis is that Body Image is affected depending on Depression
The image below is from SPSS.
What does this chart say about my data? My hypothesis is that Body Image is affected depending on Depression level ( depression high, body image is negative). I have already put in my data, got the mean from the data, and did a correlation test but I don't quite understand how to read the chart. Does this support my hypothesis?
And what is the importance of Cronbach's Alpha in SPSS? Does it just mean that a score of 0.7 or higher is reliable?
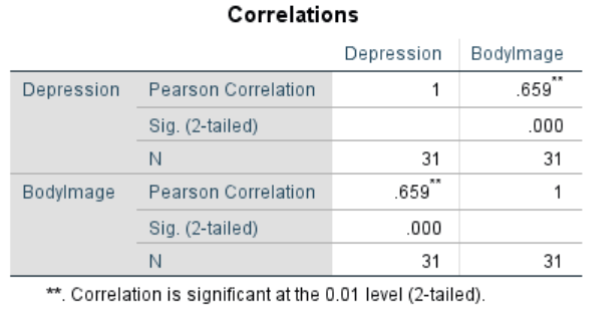
Correlations Depression BodyImage Depression Pearson Correlation 659 Sig. (2-tailed) 000 N 31 31 BodyImage Pearson Correlation 659 Sig. (2-tailed) 000 N 31 31 * Correlation is significant at the 0.01 level (2-tailed)
Step by Step Solution
There are 3 Steps involved in it

Get step-by-step solutions from verified subject matter experts