

Question: The image represents a scatter plot between Table Size (~Horizontal width) to Clarity of a diamond. The color of the point is a representation of
The image represents a scatter plot between Table Size (~Horizontal width) to Clarity of a diamond. The color of the point is a representation of the price of the diamond. Partition the data into two so that the Gini score is the lowest. After the first partition, calculate the Gini Coefficient and choose the best answer.
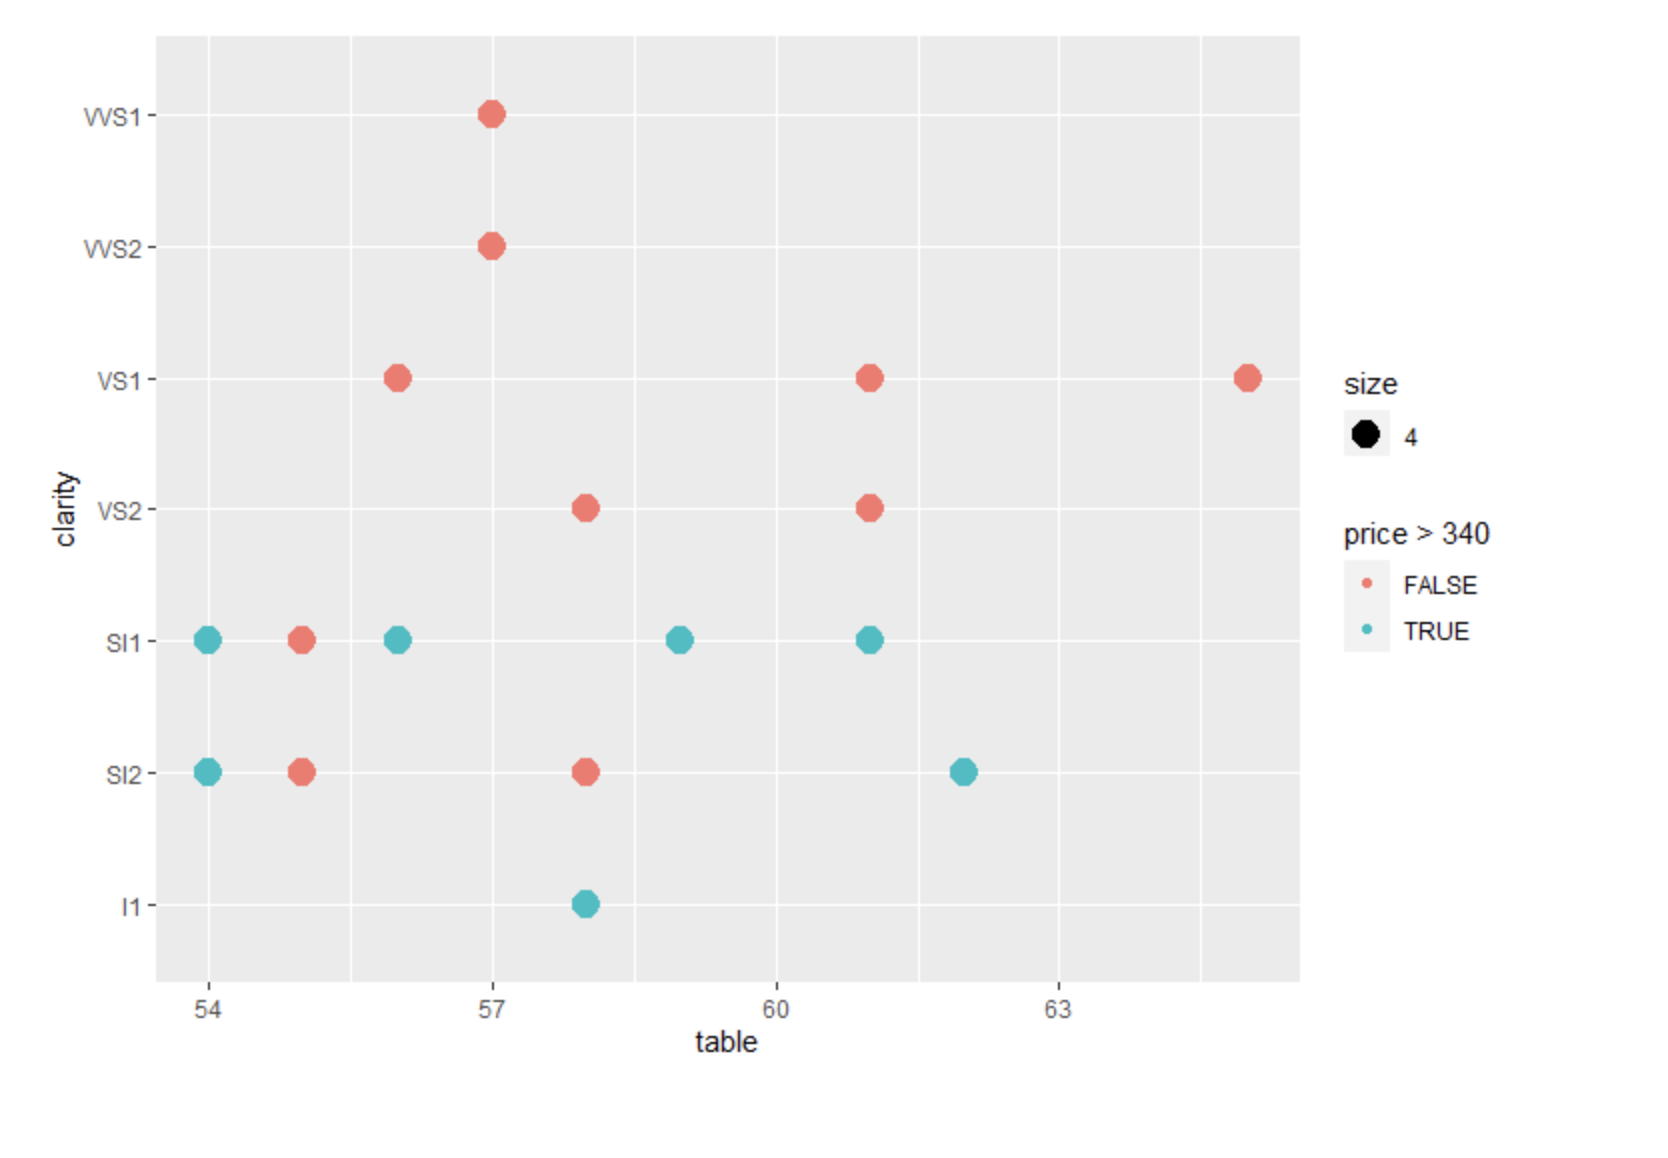
WS1 - WS2 - size VS1 - 4 clarity VS2 - price > 340 . FALSE . TRUE SI1 - S12 - 11 - 54 57 60 63 table
Step by Step Solution
There are 3 Steps involved in it
1 Expert Approved Answer
Step: 1 Unlock

Question Has Been Solved by an Expert!
Get step-by-step solutions from verified subject matter experts
Step: 2 Unlock
Step: 3 Unlock