

Question: The independent variable is used for prediction. the predictor variable is the square footage. Histogram: For your two variables, create histograms. Summary statistics: For your

The independent variable is used for prediction.
the predictor variable is the square footage.
- Histogram: For your two variables, create histograms.
- Summary statistics: For your two variables, make a table to show the mean, median, and standard deviation.
- Interpret the graphs and statistics:
- Based on your graphs and sample statistics, interpret the center, spread, shape, and any unusual characteristic (outliers, gaps, etc.) for the two variables.
- Compare and contrast the shape, center, spread, and any unusual characteristic for your sample of house sales with the national population. Is your sample representative of national housing market sales?

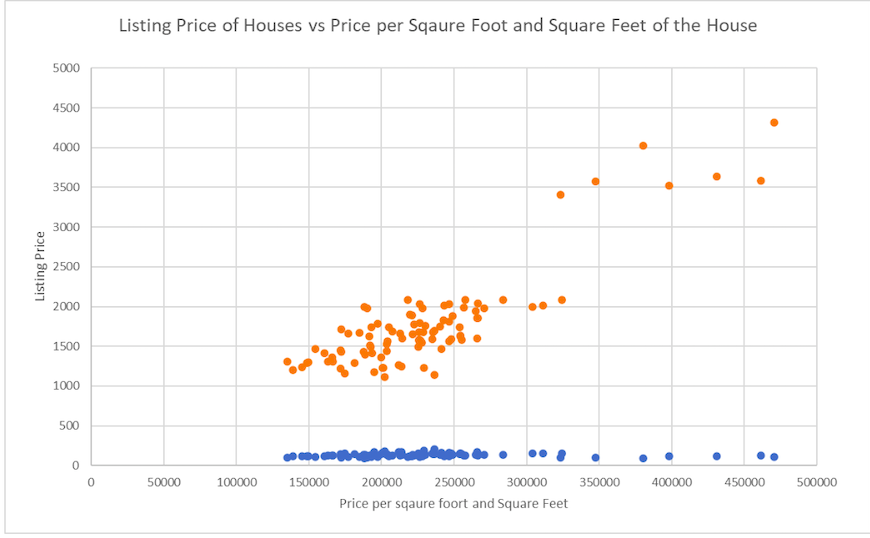
\fListing Price of Houses vs Price per Sqaure Foot and Square Feet of the House 5000 4500 4000 3500 3000 Listing Price 2500 2000 .. . 1500 1000 500 .. S 0 50000 100000 150000 200000 250000 300000 350000 400000 450000 500000 Price per sqaure foort and Square Feet
Step by Step Solution
There are 3 Steps involved in it
1 Expert Approved Answer
Step: 1 Unlock

Question Has Been Solved by an Expert!
Get step-by-step solutions from verified subject matter experts
Step: 2 Unlock
Step: 3 Unlock