Question: The industry average EBTIDA and EBIT multiples from 2016 are 14.92 and 20.40, respectively. Using these figures to find the enterprise value of Hilton's post
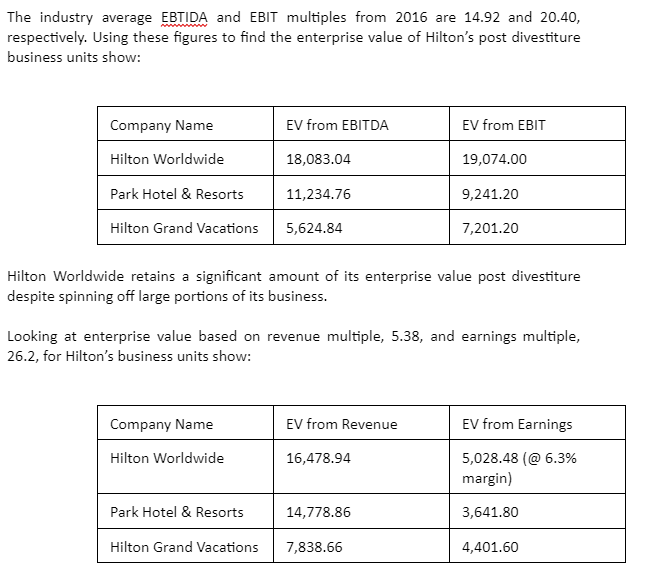
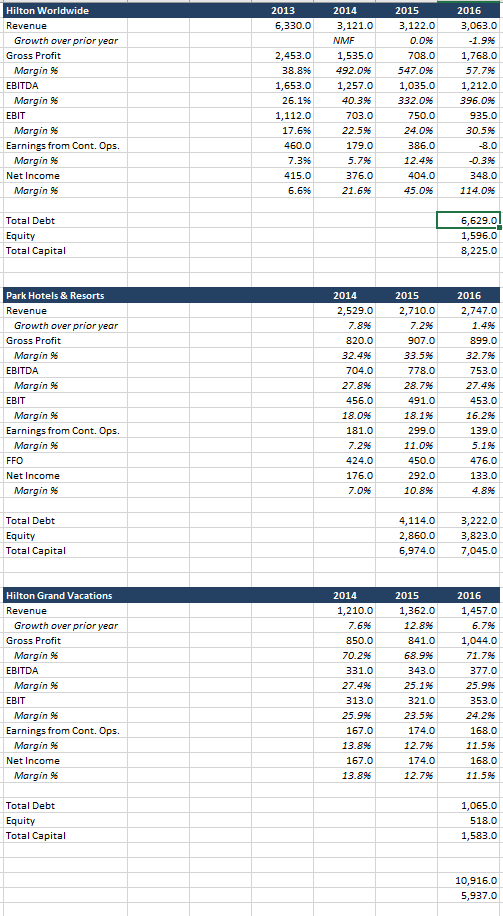
The industry average EBTIDA and EBIT multiples from 2016 are 14.92 and 20.40, respectively. Using these figures to find the enterprise value of Hilton's post divestiture business units show: Company Name EV from EBITDA EV from EBIT Hilton Worldwide 18,083.04 19,074.00 Park Hotel & Resorts 11,234.76 9,241.20 Hilton Grand Vacations 5,624.84 7,201.20 Hilton Worldwide retains a significant amount of its enterprise value post divestiture despite spinning off large portions of its business. Looking at enterprise value based on revenue multiple, 5.38, and earnings multiple, 26.2, for Hilton's business units show: Company Name EV from Revenue EV from Earnings Hilton Worldwide 16,478.94 5,028.48 (@ 6.3% margin) Park Hotel & Resorts 14,778.86 3,641.80 Hilton Grand Vacations 7,838.66 4,401.60Hilton Worldwide 2013 2014 2015 2016 Revenue 6,330.0 3,121.0 3,122.0 3,063.0 Growth over prior year NMF D.096 -1.9% Gross Profit 2,453.0 1,535.0 708.0 1,768.0 Margin 9% 38.89% 492.09% 547.0% 57.7% EBITDA 1,653.0 1,257.0 1,035.0 1,212.0 Margin 96 26.19% 40.3% 332.095 396.095 EBIT 1,112.0 703.0 750.0 935.0 Margin 9% 17.6%% 22.595 24.09% 30.5% Earnings from Cont. Ops. 460.0 179.0 386.0 -8.0 Margin 7.39% 5.79% 12.4% -0.3%% Net Income 415.0 376.0 404.0 348.0 Margin 6.6% 21.6% 45.06 114.0% Total Debt 6,629.0 Equity 1,596.0 Total Capital 8,225.0 Park Hotels & Resorts 2014 2015 2016 Revenue 2,529.0 2,710.0 2,747.0 Growth over prior year 7.895 7.29% 1.46 Gross Profit 820.0 907.0 899.0 Margin 96 32.4% 33.5% 32.7%% EBITDA 704.0 778.0 753.0 Margin 96 27.86 28.79% 27.49% EBIT 456.0 491.0 453.0 Margin $ 18.0% 18.16 16.2% Earnings from Cont. Ops. 181.0 299.0 139.0 Margin 95 7.295 11.0% 5.1% FFO 424.0 450.0 476.0 Net Income 176.0 292.0 133.0 Margin % 7.09% 10.8% 4.8% Total Debt 4,114.0 3,222.0 Equity 2,860.0 3,823.0 Total Capital 6,974.0 7,045.0 Hilton Grand Vacations 2014 2015 2016 Revenue 1,210.0 1,362.0 1,457.0 Growth over prior year 7.696 12.8%6 6.796 Gross Profit 850.0 841.0 1,044.0 Margin 9% 70.296 68.9% 71.79% EBITDA 331.0 343.0 377.0 Margin 96 27.49% 25.16 25.9% EBIT 313.0 321.0 353.0 Margin 25.96 23.5% 24.26 Earnings from Cont. Ops. 167.0 174.0 168.0 Margin $6 13.8%% 12.796 11.56 Net Income 167.0 174.0 168.0 Margin %% 13.8% 12.7% 11.5% Total Debt 1,065.0 Equity 518.0 Total Capital 1,583.0 10,916.0 5,937.0
Step by Step Solution
There are 3 Steps involved in it
1 Expert Approved Answer
Step: 1 Unlock
Question Has Been Solved by an Expert!
Get step-by-step solutions from verified subject matter experts
Step: 2 Unlock
Step: 3 Unlock
Students Have Also Explored These Related Finance Questions!