

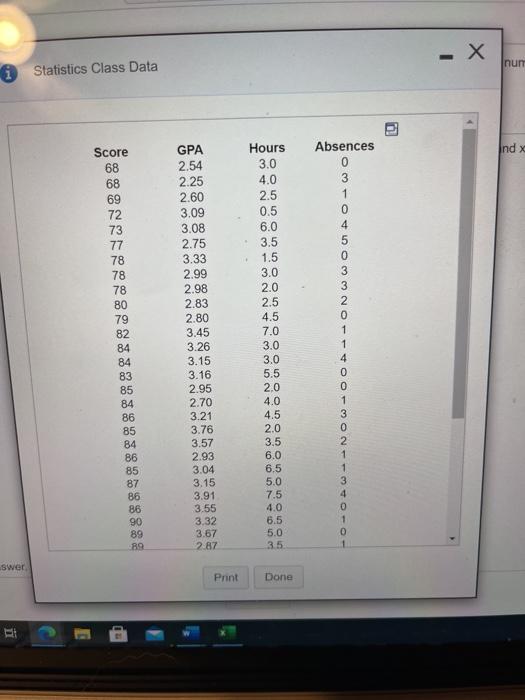
Question: the info cannot be copied and pasted - X Statistics Class Data 0 Absences Score 68 68 69 72 73 77 78 78 78 80
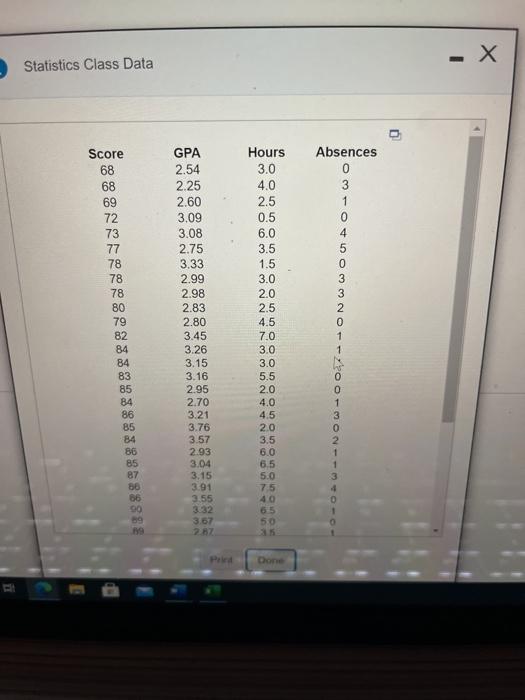
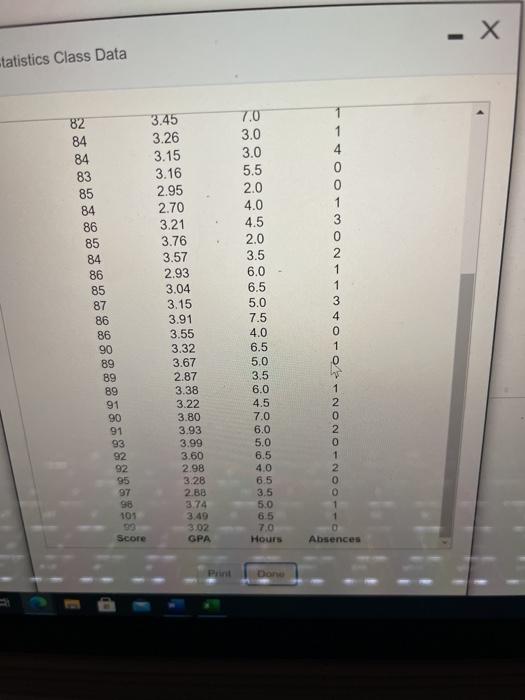
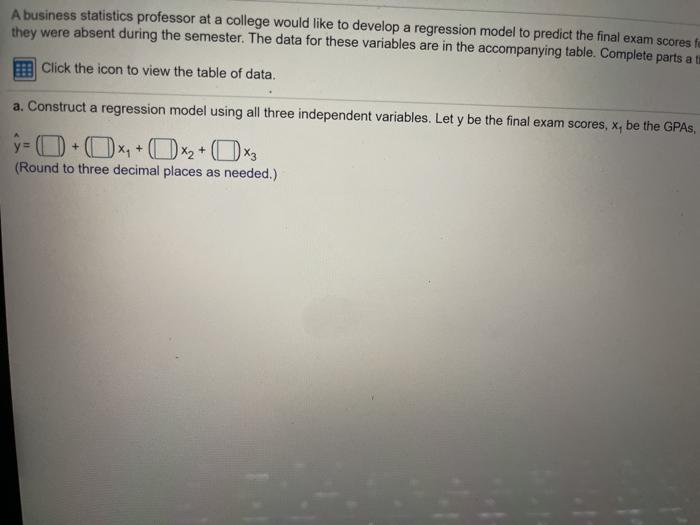
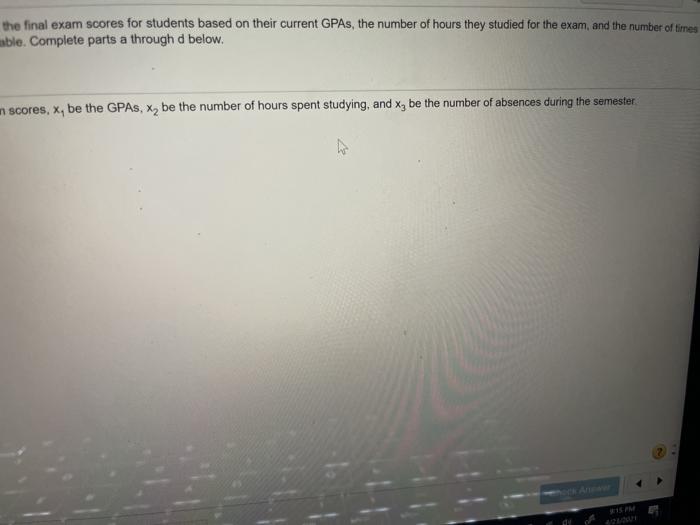

the info cannot be copied and pasted 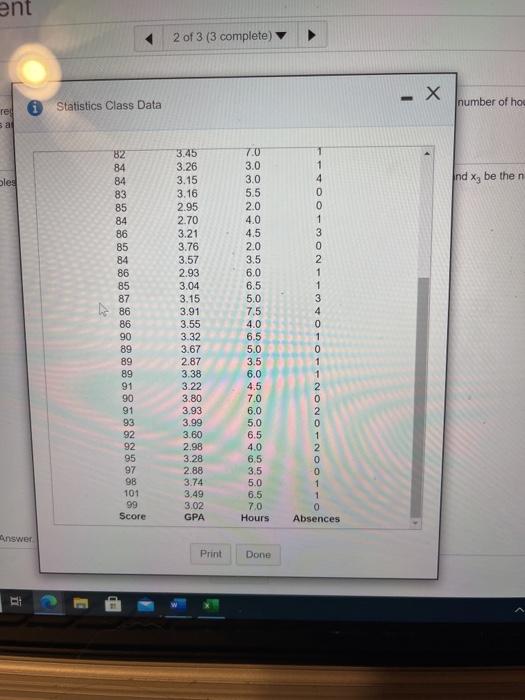
Step by Step Solution
There are 3 Steps involved in it
1 Expert Approved Answer
Step: 1 Unlock

Question Has Been Solved by an Expert!
Get step-by-step solutions from verified subject matter experts
Step: 2 Unlock
Step: 3 Unlock