

Question: The information below represents some summary statistics for MAT361, fall 2019, students in quiz 1 and quiz 2. Draw a box plots in a single
The information below represents some summary statistics for MAT361, fall 2019, students in quiz 1 and quiz 2.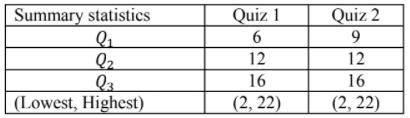
Draw a box plots in a single graph for quiz 1 and quiz 2 using the above information.
Summary statistics Quiz 1 Quiz 2 6 9 Q2 12 12 16 16 (Lowest, Highest) (2, 22) (2, 22)
Step by Step Solution
★★★★★
3.40 Rating (147 Votes )
There are 3 Steps involved in it
1 Expert Approved Answer
Step: 1 Unlock

Question Has Been Solved by an Expert!
Get step-by-step solutions from verified subject matter experts
Step: 2 Unlock
Step: 3 Unlock