

Question: The information provided in Table 2.1 and Table 2.2 are the income statement and the balance sheet of Liyen Ptd. Ltd and Tafix Ptd. Ltd.
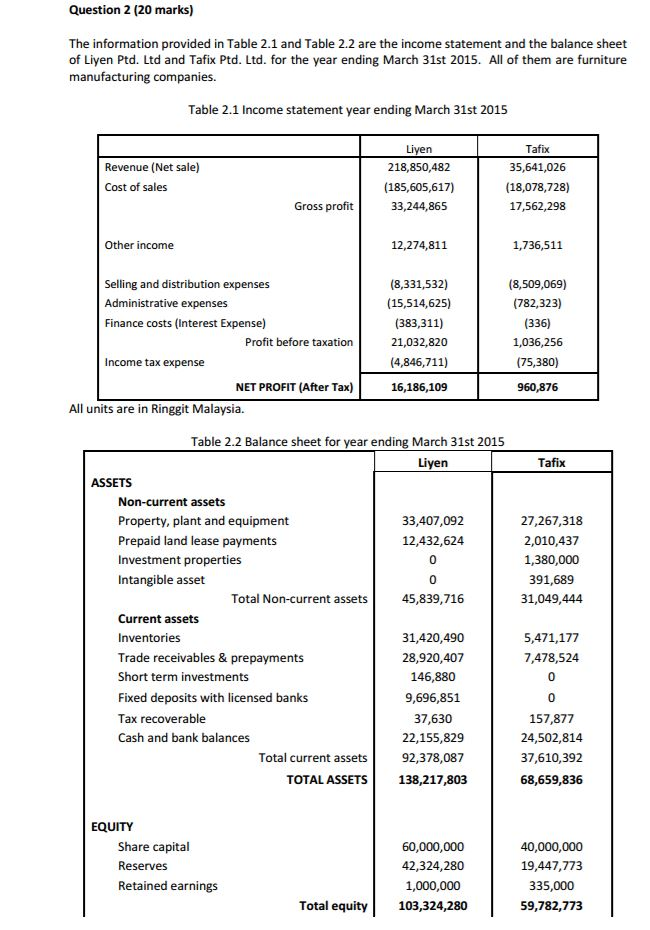
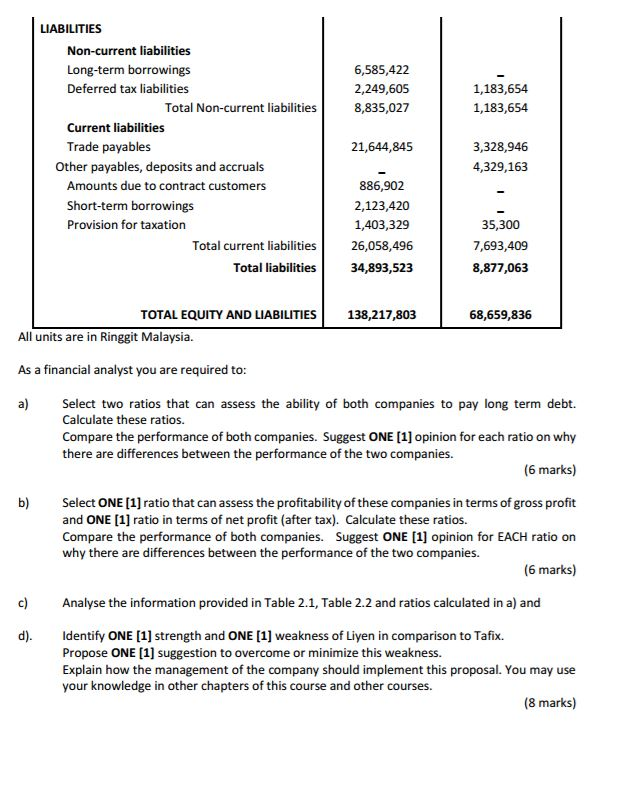
The information provided in Table 2.1 and Table 2.2 are the income statement and the balance sheet of Liyen Ptd. Ltd and Tafix Ptd. Ltd. for the year ending March 31st 2015. All of them are furniture manufacturing companies. All units are in Ringgit Malaysia. As a financial analyst you are required to: a) Select two ratios that can assess the ability of both companies to pay long term debt. Calculate these ratios. Compare the performance of both companies. Suggest ONE [1] opinion for each ratio on why there are differences between the performance of the two companies. b) Select ONE [1] ratio that can assess the profitability of these companies in terms of gross profit and ONE [1] ratio in terms of net profit (after tax). Calculate these ratios. Compare the performance of both companies. Suggest ONE [1] opinion for EACH ratio on why there are differences between the performance of the two companies. c) Analyse the information provided in Table 2.1, Table 2.2 and ratios calculated in a) and d). Identify ONE [1] strength and ONE [1] weakness of Liyen in comparison to Tafix. Propose ONE (1) suggestion to overcome or minimize this weakness. Explain how the management of the company should implement this proposal. You may use your knowledge in other chapters of this course and other courses
Step by Step Solution
There are 3 Steps involved in it

Get step-by-step solutions from verified subject matter experts