

Question: THE INSTRUCTIONS ARE THERE!! PLEASE HELP ME CREATE A SPC CHART (s) 1. A quality control manager at a manufacturing facility has taken four samples
THE INSTRUCTIONS ARE THERE!! PLEASE HELP ME CREATE A SPC CHART (s)
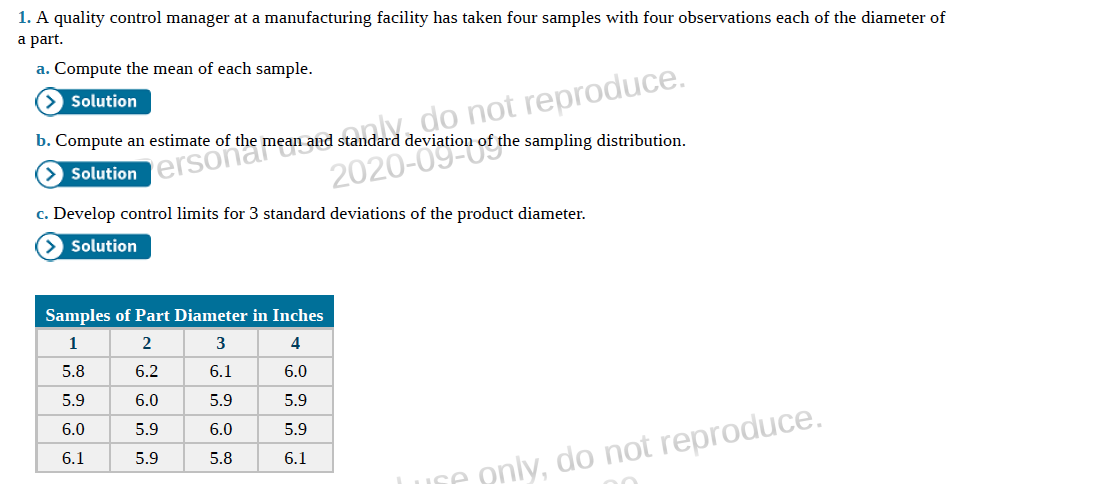
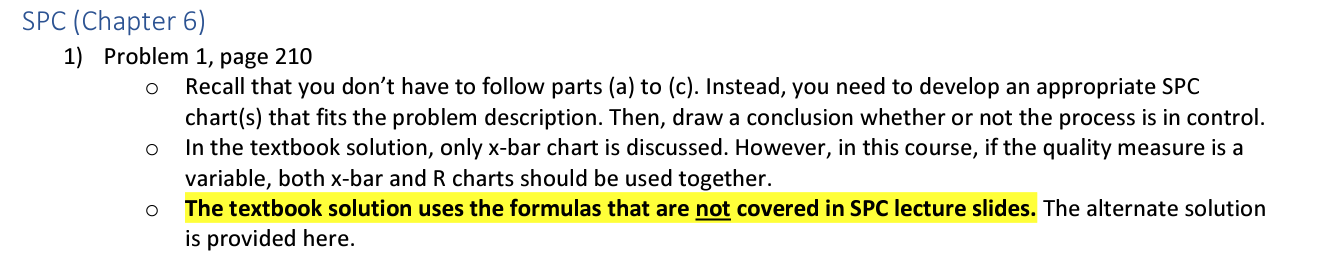
1. A quality control manager at a manufacturing facility has taken four samples with four observations each of the diameter of a part. a. Compute the mean of each sample. Solution b. Compute an estimate of the mean and standard deviation of the sampling distribution. Solution c. Develop control limits for 3 standard deviations of the product diameter. Solution Samples of Part Diameter in Inches \begin{tabular}{|c|c|c|c|} \hline 1 & 2 & 3 & 4 \\ \hline 5.8 & 6.2 & 6.1 & 6.0 \\ \hline 5.9 & 6.0 & 5.9 & 5.9 \\ \hline 6.0 & 5.9 & 6.0 & 5.9 \\ \hline 6.1 & 5.9 & 5.8 & 6.1 \\ \hline \end{tabular} 1) Problem 1, page 210 Recall that you don't have to follow parts (a) to (c). Instead, you need to develop an appropriate SPC chart(s) that fits the problem description. Then, draw a conclusion whether or not the process is in control. In the textbook solution, only x-bar chart is discussed. However, in this course, if the quality measure is a variable, both x-bar and R charts should be used together. - The textbook solution uses the formulas that are not covered in SPC lecture slides. The alternate solution is provided here
Step by Step Solution
There are 3 Steps involved in it

Get step-by-step solutions from verified subject matter experts