

Question: The interaction plot shown most likely represents which of the following? Low salinity Size of offspring High salinity Low High temp temp O a. An
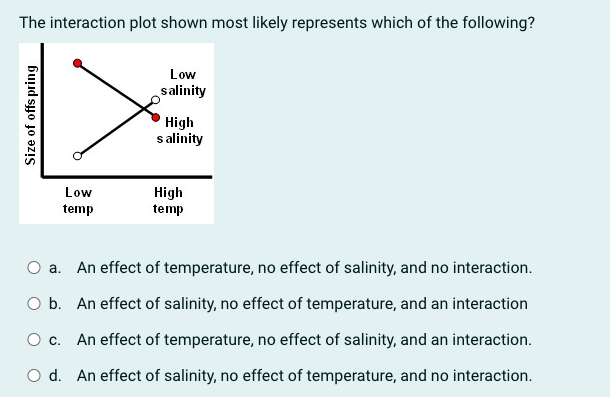


The interaction plot shown most likely represents which of the following? Low salinity Size of offspring High salinity Low High temp temp O a. An effect of temperature, no effect of salinity, and no interaction. O b. An effect of salinity, no effect of temperature, and an interaction O c. An effect of temperature, no effect of salinity, and an interaction. O d. An effect of salinity, no effect of temperature, and no interaction.A two-factor ANOVA based on a factorial design would typically calculate how many F-values of interest? O a. 2 O b. 3 O c. 4 O d. 1Which of the following best describes the usual question of interest in an ANCOVA? ( 3 a. Does the effect of one categorical variable on the response depend on the value of another categorical variable? ('3 b. Do the means of multiple groups have the same value? :_3 o. Do linear regressions fitted to data from multiple groups have the same slope? C) d. What is the relationship between a numerical variable and a categorical variable? Which of the following best describes another reason for conducting an ANCOVA? C3 a. To increase the number of variables and thereby reduce the Pvalue 3 b. To reduce the overall sum of squares C 3 c. To adjust the categorical variable's effect on the response to account for the effect of the numerical variable C 3 d. To compare the numerical variable's effect on the response to the effect of the categorical variable The presence of an interaction in an ANCDVA would indicate which of the following? (I) a. The slopes of the regression lines are the same for all groups in the categorical variable. (I) p. The intercepts of the regression lines are different for some groups in the categorical variable. (I) c. The slopes of the regression lines are different for some groups in the categorical variable. (I) d. The intercepts of the regression lines are the same for all groups in the categorical variable
Step by Step Solution
There are 3 Steps involved in it

Get step-by-step solutions from verified subject matter experts