

Question: The IOS schedule is plotted on same graph as the the MCC schedule 20% 19% --- JOS Schedule MCC Schedule Project A return = 18%
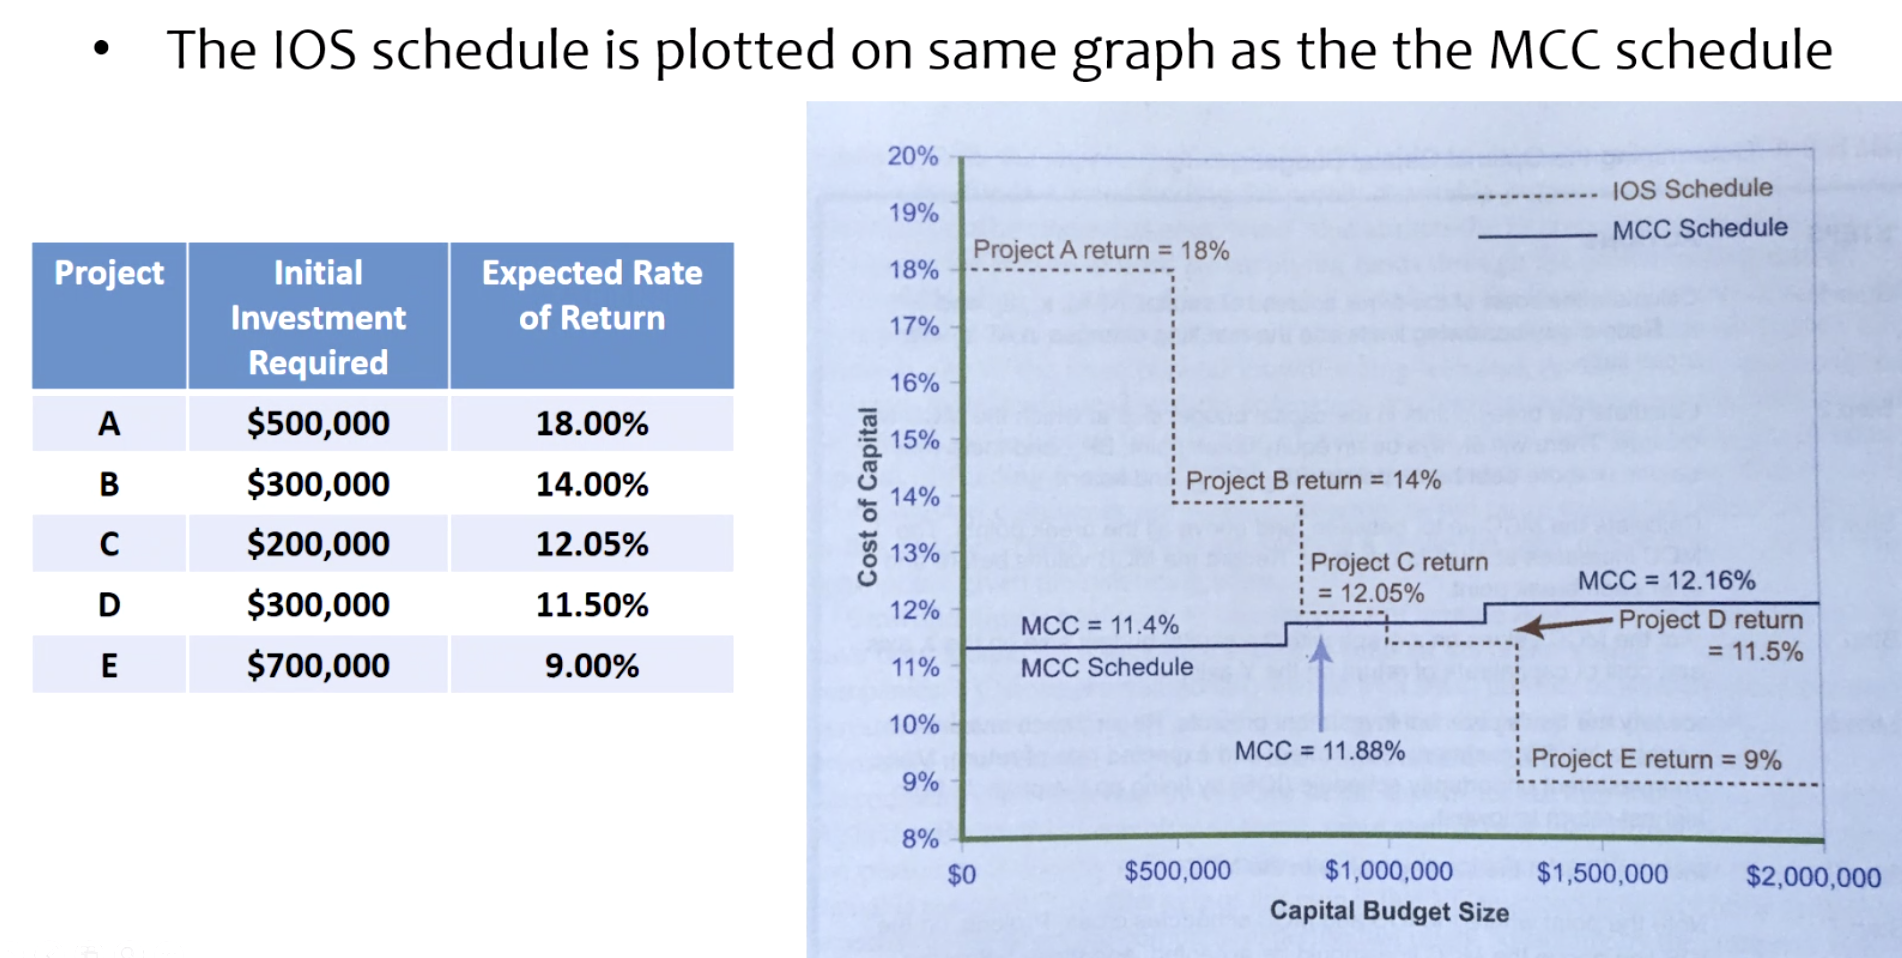

The IOS schedule is plotted on same graph as the the MCC schedule 20% 19% --- JOS Schedule MCC Schedule Project A return = 18% Project 18% Expected Rate of Return 17% A 18.00% Initial Investment Required $500,000 $300,000 $200,000 $300,000 $700,000 14.00% 12.05% Cost of Capital Project B return = 14% Project C return i = 12.05% 12% 11.50% 9.00% MCC = 11.4% MCC Schedule MCC = 12.16% Project D return = 11.5% 11% 10% MCC = 11.88% Project E return = 9% 9% 8% $0 $500,000 $1,000,000 Capital Budget Size $1,500,000 $2,000,000 Which projects should the firm accept based on the MCC and IOS graph? Check all that apply. (check all that apply) OB
Step by Step Solution
There are 3 Steps involved in it

Get step-by-step solutions from verified subject matter experts