

The IQ scores of 50 students are given below. 105 117 87 100 104 89 87 109
Fantastic news! We've Found the answer you've been seeking!
Question:
The IQ scores of 50 students are given below.
| 105 | 117 | 87 | 100 | 104 | 89 | 87 | 109 | 95 | 114 |
| 88 | 107 | 86 | 92 | 88 | 95 | 90 | 113 | 91 | 116 |
| 115 | 86 | 85 | 89 | 88 | 86 | 93 | 99 | 104 | 117 |
| 87 | 105 | 95 | 109 | 100 | 98 | 113 | 101 | 104 | 96 |
| 94 | 91 | 101 | 111 | 118 | 107 | 116 | 115 | 87 | 115 |
(a) Construct a grouped frequency distribution for the data. Use85-89 for the first class and use the same width for eachsubsequent class.
| Class | Frequency |
| 85 - 89 | |
| - | |
| - | |
| - | |
| - | |
| - | |
| - |
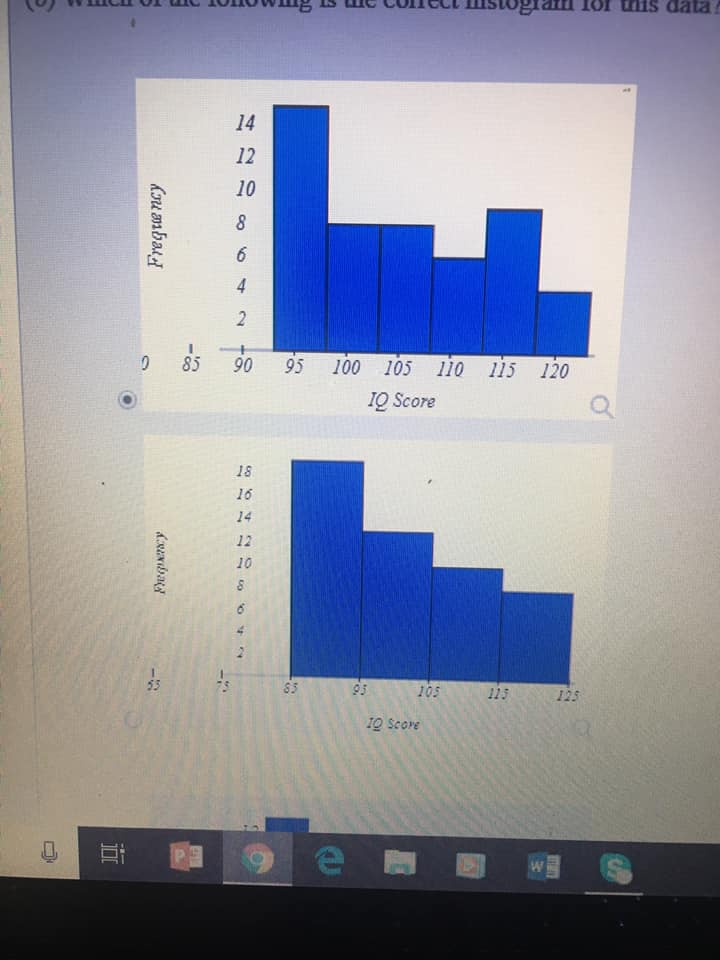
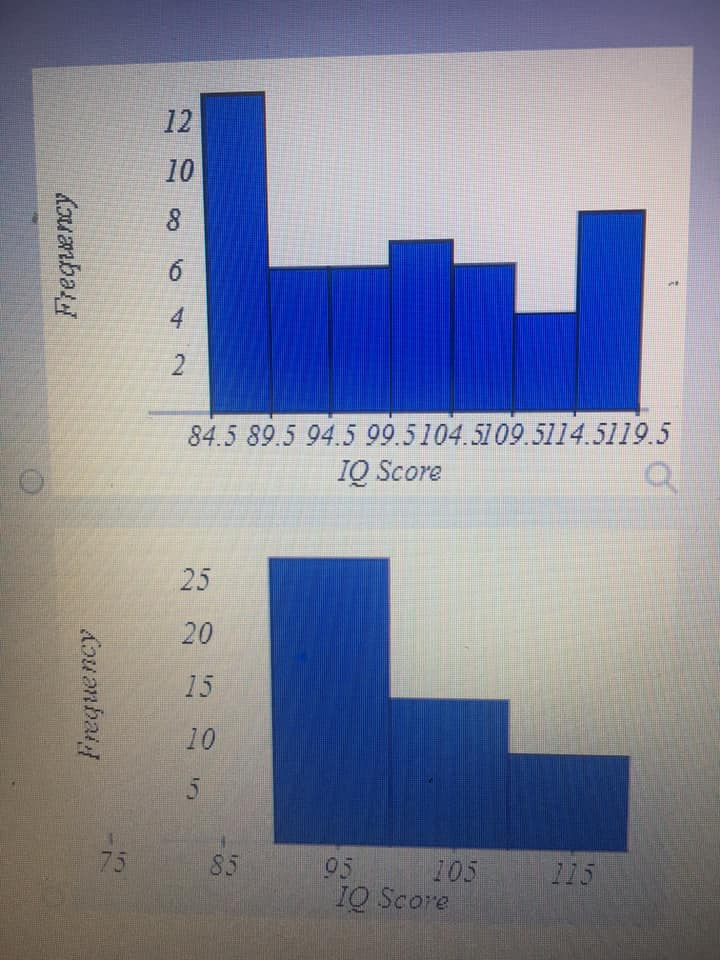
(b) Which of the following is the correct histogram for thisdata?
Expert Answer:

Related Book For 

Posted Date:
