

Question: The k-means cluster method has a Matlab built-in with sample scripts given at https://uk.mathworks.com/help/stats/kmeans.html. Below the first example is slightly adapted to a script for
The k-means cluster method has a Matlab built-in with sample scripts given at https://uk.mathworks.com/help/stats/kmeans.html. Below the first example is slightly adapted to a script for your convenience.
Your task is to adapt this script to different number of clusters (say, 2 clusters, 4 clusters, etc.). In your reflective portfolio, attach the result figure(s) from Matlab, and summarise in a few sentences in terms of how the choice of number of clusters affects the results.
close all;
clear all;
load fisheriris
X = meas(:,3:4);
figure(1);
plot(X(:,1),X(:,2),'k*','MarkerSize',5);
title 'Fisher''s Iris Data';
xlabel 'Petal Lengths (cm)';
ylabel 'Petal Widths (cm)';
ncluster = 3;
[idx,C] = kmeans(X,ncluster);
figure(2);
hold on;
plot(X(idx==1,1),X(idx==1,2),'k*','MarkerSize',5);
plot(X(idx==2,1),X(idx==2,2),'b^','MarkerSize',5);
plot(X(idx==3,1),X(idx==3,2),'rs','MarkerSize',5);
hold off;
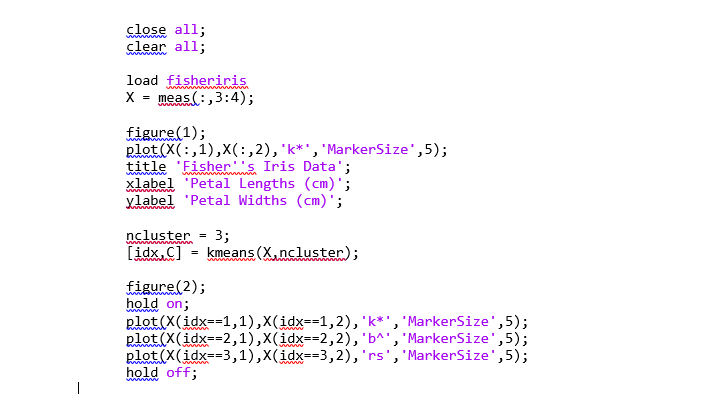
close all; clear all; load fisheriris X= meas (:,3:4); figure (1) ; plot (X(:,1),X(:,2), , k ', 'MarkerSize ' , 5); title 'Fisher.'s Iris Data'; xlabel 'Petal Lengths (cm)'; ylabel 'Petal Widths (cm)'; ncluster =3; [idx,C]=kmeans(X,ncluster) figure (2); hold on; plot (X(idx==1,1),X(idx==1,2), ' k * ' , 'MarkerSize ' , 5); plot(X(idx==2,1),X(idx==2,2),b ', 'MarkerSize ', 5); plot (X(idx==3,1),X(idx==3,2), ,rs', 'MarkerSize' , 5); hold off
Step by Step Solution
There are 3 Steps involved in it

Get step-by-step solutions from verified subject matter experts