

Question: The last two attachments show the .csv file. Column U aka Column 22 will the positive cases being looked at for all the states for
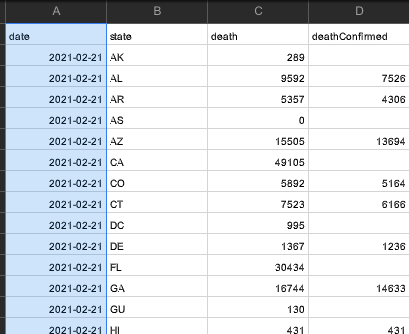
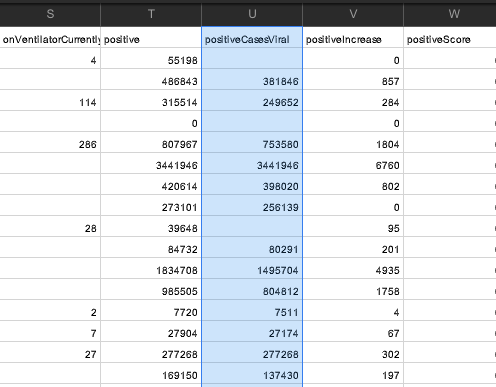
The last two attachments show the .csv file. Column U aka Column 22 will the positive cases being looked at for all the states for each date.
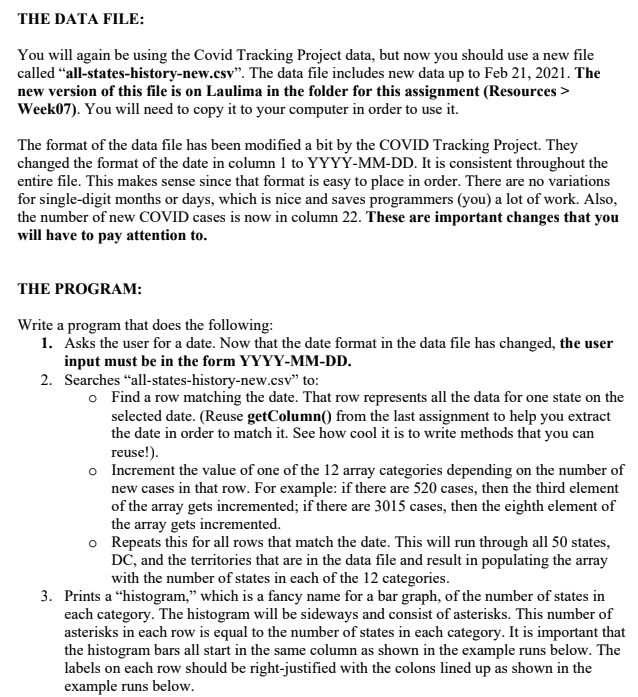
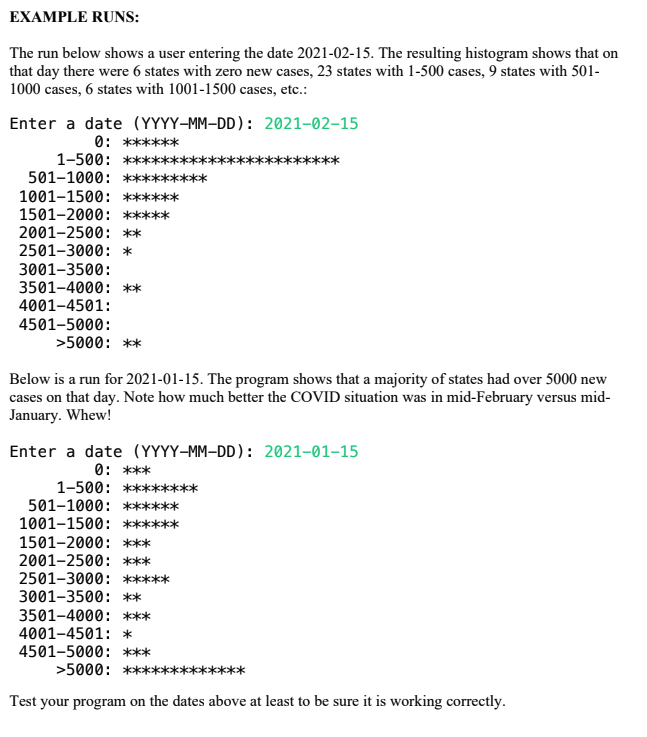
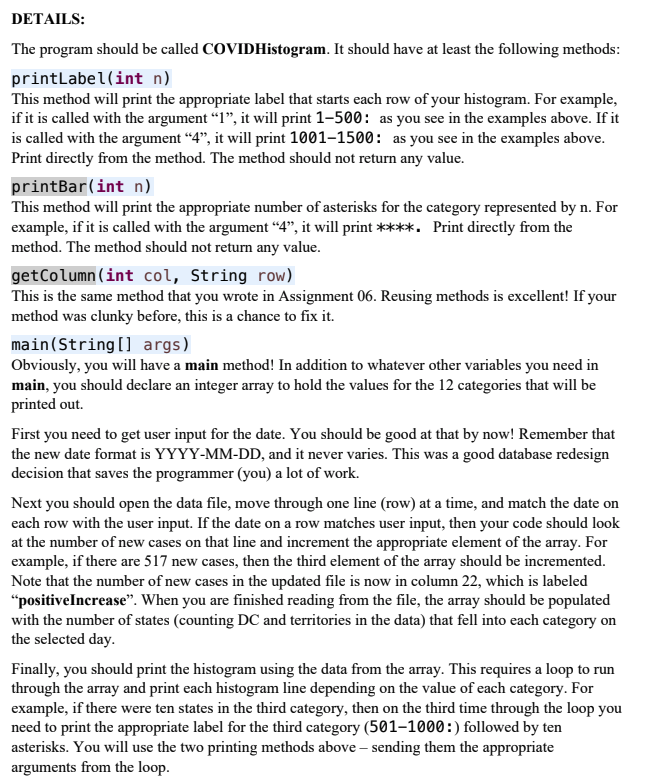
Using a one-dimensional array o Declaring an array o Assigning values to array elements o Iterating through an array Assignment Date: Tuesday, February 23 Due Date: Tuesday, March 2 (by 11:55 pm) Late assignment: 50% penalty Not accepted after: Wednesday, March 3 (by 11:55 pm) This assignment is the first time you will be using an array. You are going to use an integer array to hold the number of states that had new COVID cases on a particular date in 12 different categories: The first element of the array will hold the number of states that had zero cases on that date. The second element of the array will hold the number of states that had 1-500 cases on that date. The third element of the array will hold the number of states that had 501-1000 cases on that date. The fourth element of the array will hold the number of states that had 1001-1500 cases on that date. The fifth element of the array will hold the number of states that had 1501-2000 cases on that date. The sixth element of the array will hold the number of states that had 2001-2500 cases on that date. The seventh element of the array will hold the number of states that had 2501-3000 cases on that date. The eighth element of the array will hold the number of states that had 3001-3500 cases on that date. The ninth element of the array will hold the number of states that had 3501-4000 cases on that date. The tenth element of the array will hold the number of states that had 4001-4500 cases on that date. The eleventh element of the array will hold the number of states that had 4501-5000 cases on that date. The last element of the array will hold the number of states that had >5000 cases on that date. THE DATA FILE: You will again be using the Covid Tracking Project data, but now you should use a new file called "all-states-history-new.csv". The data file includes new data up to Feb 21, 2021. The new version of this file is on Laulima in the folder for this assignment (Resources > Week07). You will need to copy it to your computer in order to use it. The format of the data file has been modified a bit by the COVID Tracking Project. They changed the format of the date in column 1 to YYYY-MM-DD. It is consistent throughout the entire file. This makes sense since that format is easy to place in order. There are no variations for single-digit months or days, which is nice and saves programmers (you) a lot of work. Also, the number of new COVID cases is now in column 22. These are important changes that you will have to pay attention to. THE PROGRAM: Write a program that does the following: 1. Asks the user for a date. Now that the date format in the data file has changed, the user input must be in the form YYYY-MM-DD. 2. Searches "all-states-history-new.csv" to: o Find a row matching the date. That row represents all the data for one state on the selected date. (Reuse getColumn() from the last assignment to help you extract the date in order to match it. See how cool it is to write methods that you can reuse!). o Increment the value of one of the 12 array categories depending on the number of new cases in that row. For example: if there are 520 cases, then the third element of the array gets incremented; if there are 3015 cases, then the eighth element of the array gets incremented. o Repeats this for all rows that match the date. This will run through all 50 states, DC, and the territories that are in the data file and result in populating the array with the number of states in each of the 12 categories. 3. Prints a histogram, which is a fancy name for a bar graph, of the number of states in each category. The histogram will be sideways and consist of asterisks. This number of asterisks in each row is equal to the number of states in each category. It is important that the histogram bars all start in the same column as shown in the example runs below. The labels on each row should be right-justified with the colons lined up as shown in the example runs below. EXAMPLE RUNS: The run below shows a user entering the date 2021-02-15. The resulting histogram shows that on that day there were 6 states with zero new cases, 23 states with 1-500 cases, 9 states with 501- 1000 cases, 6 states with 1001-1500 cases, etc.: Enter a date (YYYY-MM-DD): 2021-02-15 0: ****** 1-500: *** **** 501-1000: *** 1001-1500: *** 1501-2000: *** 2001-2500: ** 2501-3000: * 3001-3500: 3501-4000: ** 4001-4501: 4501-5000: >5000: ** Below is a run for 2021-01-15. The program shows that a majority of states had over 5000 new cases on that day. Note how much better the COVID situation was in mid-February versus mid- January. Whew! Enter a date (YYYY-MM-DD): 2021-01-15 0: *** 1-500: ** 501-1000: **** 1001-1500: **** 1501-2000: *** 2001-2500: *** 2501-3000: ***** 3001-3500: ** 3501-4000: *** 4001-4501: * 4501-5000: *** >5000: ** Test your program on the dates above at least to be sure it is working correctly. DETAILS: The program should be called COVIDHistogram. It should have at least the following methods: printLabel(int n) This method will print the appropriate label that starts each row of your histogram. For example, if it is called with the argument 1, it will print 1500: as you see in the examples above. If it is called with the argument 4, it will print 1001-1500: as you see in the examples above. Print directly from the method. The method should not return any value. printBar(int n) This method will print the appropriate number of asterisks for the category represented by n. For example, if it is called with the argument 4, it will print ****. Print directly from the method. The method should not return any value. getColumn(int col, String row) This is the same method that you wrote in Assignment 06. Reusing methods is excellent! If your method was clunky before, this is a chance to fix it. main(String[] args) Obviously, you will have a main method! In addition to whatever other variables you need in main, you should declare an integer array to hold the values for the 12 categories that will be printed out First you need to get user input for the date. You should be good at that by now! Remember that the new date format is YYYY-MM-DD, and it never varies. This was a good database redesign decision that saves the programmer (you) a lot of work. Next you should open the data file, move through one line (row) at a time, and match the date on each row with the user input. If the date on a row matches user input, then your code should look at the number of new cases on that line and increment the appropriate element of the array. For example, if there are 517 new cases, then the third element of the array should be incremented. Note that the number of new cases in the updated file is now in column 22, which is labeled positiveIncrease. When you are finished reading from the file, the array should be populated with the number of states (counting DC and territories in the data) that fell into each category on the selected day. Finally, you should print the histogram using the data from the array. This requires a loop to run through the array and print each histogram line depending on the value of each category. For example, if there were ten states in the third category, then on the third time through the loop you need to print the appropriate label for the third category (501-1000:) followed by ten asterisks. You will use the two printing methods above sending them the appropriate arguments from the loop. . B C D date state death death Confimed 2021-02-21 AK 289 2021-02-21 AL 9592 7526 2021-02-21 AR 5357 4306 0 2021-02-21 AS 2021-02-21 AZ 2021-02-21 CA 15505 13694 49105 2021-02-21 Co 5892 5164 2021-02-21 CT 7523 6166 2021-02-21 DC 995 2021-02-21 DE 1367 1236 2021-02-21 FL 30434 2021-02-21 GA 16744 14633 2021-02-21 GU 130 2021-02-21 | HI 431 431 S T U W on VentilatorCurrently positive positive CasesViral positivelncrease positiveScore 4 55198 0 486843 381846 857 114 315514 249652 284 0 0 286 B07967 753580 1804 344 1946 344 1946 6760 420614 398020 802 273101 256139 0 28 39648 95 84732 80291 201 1834708 1495704 4935 985505 804812 1758 2 7720 7511 4 7 27904 27174 67 27 277268 277268 302 169150 137430 197 Using a one-dimensional array o Declaring an array o Assigning values to array elements o Iterating through an array Assignment Date: Tuesday, February 23 Due Date: Tuesday, March 2 (by 11:55 pm) Late assignment: 50% penalty Not accepted after: Wednesday, March 3 (by 11:55 pm) This assignment is the first time you will be using an array. You are going to use an integer array to hold the number of states that had new COVID cases on a particular date in 12 different categories: The first element of the array will hold the number of states that had zero cases on that date. The second element of the array will hold the number of states that had 1-500 cases on that date. The third element of the array will hold the number of states that had 501-1000 cases on that date. The fourth element of the array will hold the number of states that had 1001-1500 cases on that date. The fifth element of the array will hold the number of states that had 1501-2000 cases on that date. The sixth element of the array will hold the number of states that had 2001-2500 cases on that date. The seventh element of the array will hold the number of states that had 2501-3000 cases on that date. The eighth element of the array will hold the number of states that had 3001-3500 cases on that date. The ninth element of the array will hold the number of states that had 3501-4000 cases on that date. The tenth element of the array will hold the number of states that had 4001-4500 cases on that date. The eleventh element of the array will hold the number of states that had 4501-5000 cases on that date. The last element of the array will hold the number of states that had >5000 cases on that date. THE DATA FILE: You will again be using the Covid Tracking Project data, but now you should use a new file called "all-states-history-new.csv". The data file includes new data up to Feb 21, 2021. The new version of this file is on Laulima in the folder for this assignment (Resources > Week07). You will need to copy it to your computer in order to use it. The format of the data file has been modified a bit by the COVID Tracking Project. They changed the format of the date in column 1 to YYYY-MM-DD. It is consistent throughout the entire file. This makes sense since that format is easy to place in order. There are no variations for single-digit months or days, which is nice and saves programmers (you) a lot of work. Also, the number of new COVID cases is now in column 22. These are important changes that you will have to pay attention to. THE PROGRAM: Write a program that does the following: 1. Asks the user for a date. Now that the date format in the data file has changed, the user input must be in the form YYYY-MM-DD. 2. Searches "all-states-history-new.csv" to: o Find a row matching the date. That row represents all the data for one state on the selected date. (Reuse getColumn() from the last assignment to help you extract the date in order to match it. See how cool it is to write methods that you can reuse!). o Increment the value of one of the 12 array categories depending on the number of new cases in that row. For example: if there are 520 cases, then the third element of the array gets incremented; if there are 3015 cases, then the eighth element of the array gets incremented. o Repeats this for all rows that match the date. This will run through all 50 states, DC, and the territories that are in the data file and result in populating the array with the number of states in each of the 12 categories. 3. Prints a histogram, which is a fancy name for a bar graph, of the number of states in each category. The histogram will be sideways and consist of asterisks. This number of asterisks in each row is equal to the number of states in each category. It is important that the histogram bars all start in the same column as shown in the example runs below. The labels on each row should be right-justified with the colons lined up as shown in the example runs below. EXAMPLE RUNS: The run below shows a user entering the date 2021-02-15. The resulting histogram shows that on that day there were 6 states with zero new cases, 23 states with 1-500 cases, 9 states with 501- 1000 cases, 6 states with 1001-1500 cases, etc.: Enter a date (YYYY-MM-DD): 2021-02-15 0: ****** 1-500: *** **** 501-1000: *** 1001-1500: *** 1501-2000: *** 2001-2500: ** 2501-3000: * 3001-3500: 3501-4000: ** 4001-4501: 4501-5000: >5000: ** Below is a run for 2021-01-15. The program shows that a majority of states had over 5000 new cases on that day. Note how much better the COVID situation was in mid-February versus mid- January. Whew! Enter a date (YYYY-MM-DD): 2021-01-15 0: *** 1-500: ** 501-1000: **** 1001-1500: **** 1501-2000: *** 2001-2500: *** 2501-3000: ***** 3001-3500: ** 3501-4000: *** 4001-4501: * 4501-5000: *** >5000: ** Test your program on the dates above at least to be sure it is working correctly. DETAILS: The program should be called COVIDHistogram. It should have at least the following methods: printLabel(int n) This method will print the appropriate label that starts each row of your histogram. For example, if it is called with the argument 1, it will print 1500: as you see in the examples above. If it is called with the argument 4, it will print 1001-1500: as you see in the examples above. Print directly from the method. The method should not return any value. printBar(int n) This method will print the appropriate number of asterisks for the category represented by n. For example, if it is called with the argument 4, it will print ****. Print directly from the method. The method should not return any value. getColumn(int col, String row) This is the same method that you wrote in Assignment 06. Reusing methods is excellent! If your method was clunky before, this is a chance to fix it. main(String[] args) Obviously, you will have a main method! In addition to whatever other variables you need in main, you should declare an integer array to hold the values for the 12 categories that will be printed out First you need to get user input for the date. You should be good at that by now! Remember that the new date format is YYYY-MM-DD, and it never varies. This was a good database redesign decision that saves the programmer (you) a lot of work. Next you should open the data file, move through one line (row) at a time, and match the date on each row with the user input. If the date on a row matches user input, then your code should look at the number of new cases on that line and increment the appropriate element of the array. For example, if there are 517 new cases, then the third element of the array should be incremented. Note that the number of new cases in the updated file is now in column 22, which is labeled positiveIncrease. When you are finished reading from the file, the array should be populated with the number of states (counting DC and territories in the data) that fell into each category on the selected day. Finally, you should print the histogram using the data from the array. This requires a loop to run through the array and print each histogram line depending on the value of each category. For example, if there were ten states in the third category, then on the third time through the loop you need to print the appropriate label for the third category (501-1000:) followed by ten asterisks. You will use the two printing methods above sending them the appropriate arguments from the loop. . B C D date state death death Confimed 2021-02-21 AK 289 2021-02-21 AL 9592 7526 2021-02-21 AR 5357 4306 0 2021-02-21 AS 2021-02-21 AZ 2021-02-21 CA 15505 13694 49105 2021-02-21 Co 5892 5164 2021-02-21 CT 7523 6166 2021-02-21 DC 995 2021-02-21 DE 1367 1236 2021-02-21 FL 30434 2021-02-21 GA 16744 14633 2021-02-21 GU 130 2021-02-21 | HI 431 431 S T U W on VentilatorCurrently positive positive CasesViral positivelncrease positiveScore 4 55198 0 486843 381846 857 114 315514 249652 284 0 0 286 B07967 753580 1804 344 1946 344 1946 6760 420614 398020 802 273101 256139 0 28 39648 95 84732 80291 201 1834708 1495704 4935 985505 804812 1758 2 7720 7511 4 7 27904 27174 67 27 277268 277268 302 169150 137430 197
Step by Step Solution
There are 3 Steps involved in it

Get step-by-step solutions from verified subject matter experts