

Question: The level 2 variance analysis table is shown here: Flexible Flexible Actual Results Variances Budget Volume Variances Sales-Static Units sold 46,000 44,000 00 $2,475,000 D
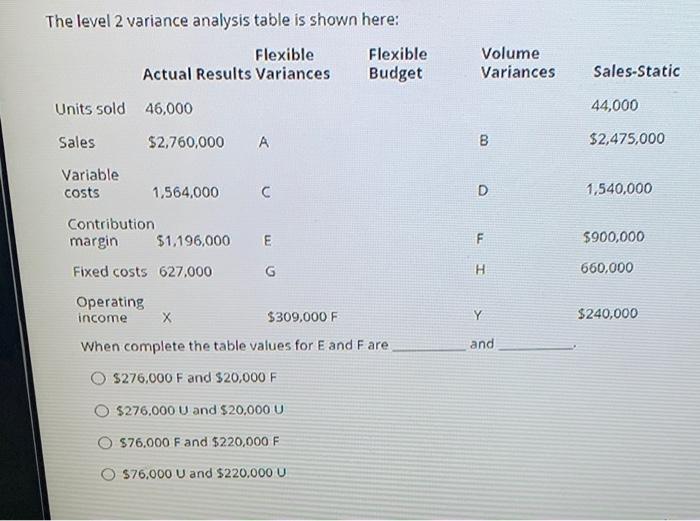
The level 2 variance analysis table is shown here: Flexible Flexible Actual Results Variances Budget Volume Variances Sales-Static Units sold 46,000 44,000 00 $2,475,000 D 1,540,000 F $900,000 H 660,000 Sales $2,760,000 Variable costs 1.564,000 Contribution margin $1,196,000 E Fixed costs 627.000 G Operating income $309,000 F When complete the table values for E and Fare $276,000 F and $20,000 F $276,000 U and $20,000 U Y Y $240,000 and $76,000 F and $220,000 F O $76,000 U and $220.000 U
Step by Step Solution
There are 3 Steps involved in it
1 Expert Approved Answer
Step: 1 Unlock

Question Has Been Solved by an Expert!
Get step-by-step solutions from verified subject matter experts
Step: 2 Unlock
Step: 3 Unlock