

Question: The linear correlation coefficient r is The test stat t is The p value is Question Help Listed below are the numbers of cricket chirps
The linear correlation coefficient r is The test stat t is The p value is
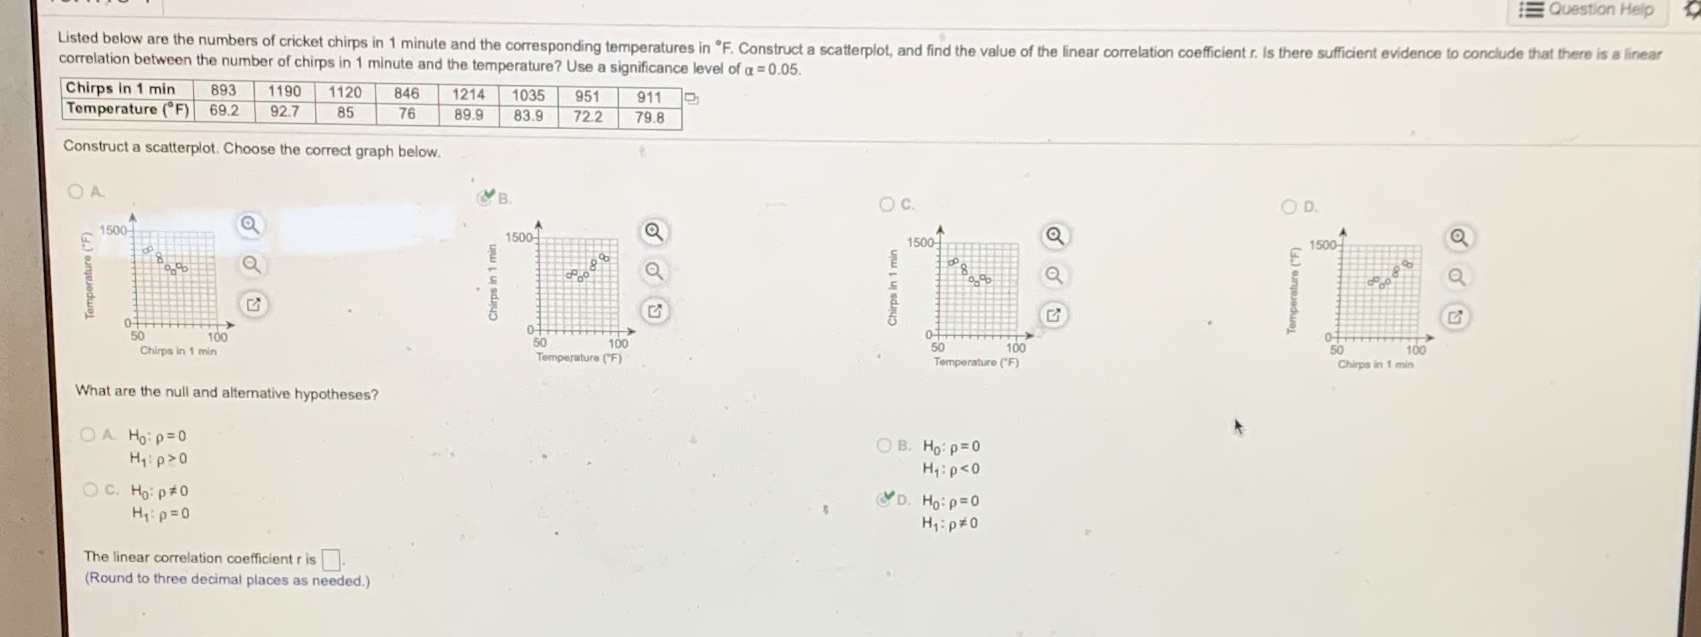
Question Help Listed below are the numbers of cricket chirps in 1 minute and the corresponding temperatures in "F. Construct a scatterplot, and find the value of the linear correlation coefficient r. Is there sufficient evidence to conclude that there is a linear correlation between the number of chirps in 1 minute and the temperature? Use a significance level of a = 0.05. Chirps in 1 min 893 1190 1120 846 1214 1035 951 911 2 Temperature (F) 69.2 92.7 85 76 89.9 83.9 72.2 79.8 Construct a scatterplot. Choose the correct graph below. O A. O C. OD. 1500 Q Temperature ("F) Chirps in 1 min 1500- Q Chirps in 1 min 1500 Q Temperature ("F) 1500- Q 100 50 100 50 100 50 100 Chirps in 1 min Temperature ("F) Temperature ("F) Chirps in 1 min What are the null and alternative hypotheses? OA Ho: P=0 OB. Ho: p= 0 Hip20 Hip
Step by Step Solution
There are 3 Steps involved in it

Get step-by-step solutions from verified subject matter experts