

Question: The link works just do it please. https://drive.google.com/file/d/1P2_sA2H0tK43mhHLpRSXbvG4KqhtE_K0/view?usp=sharing Please answer these questions. M Fwd: - alaaalbarghouthi6@gmail. x + X G mail.google.com/mail/u/0/#starred/FMfcgxwLswMsknTZFNqgqqXgBdRPXWXz?projector=1&messagePartld=0.2 . .. : Apps
The link works just do it please.
https://drive.google.com/file/d/1P2_sA2H0tK43mhHLpRSXbvG4KqhtE_K0/view?usp=sharing
Please answer these questions.
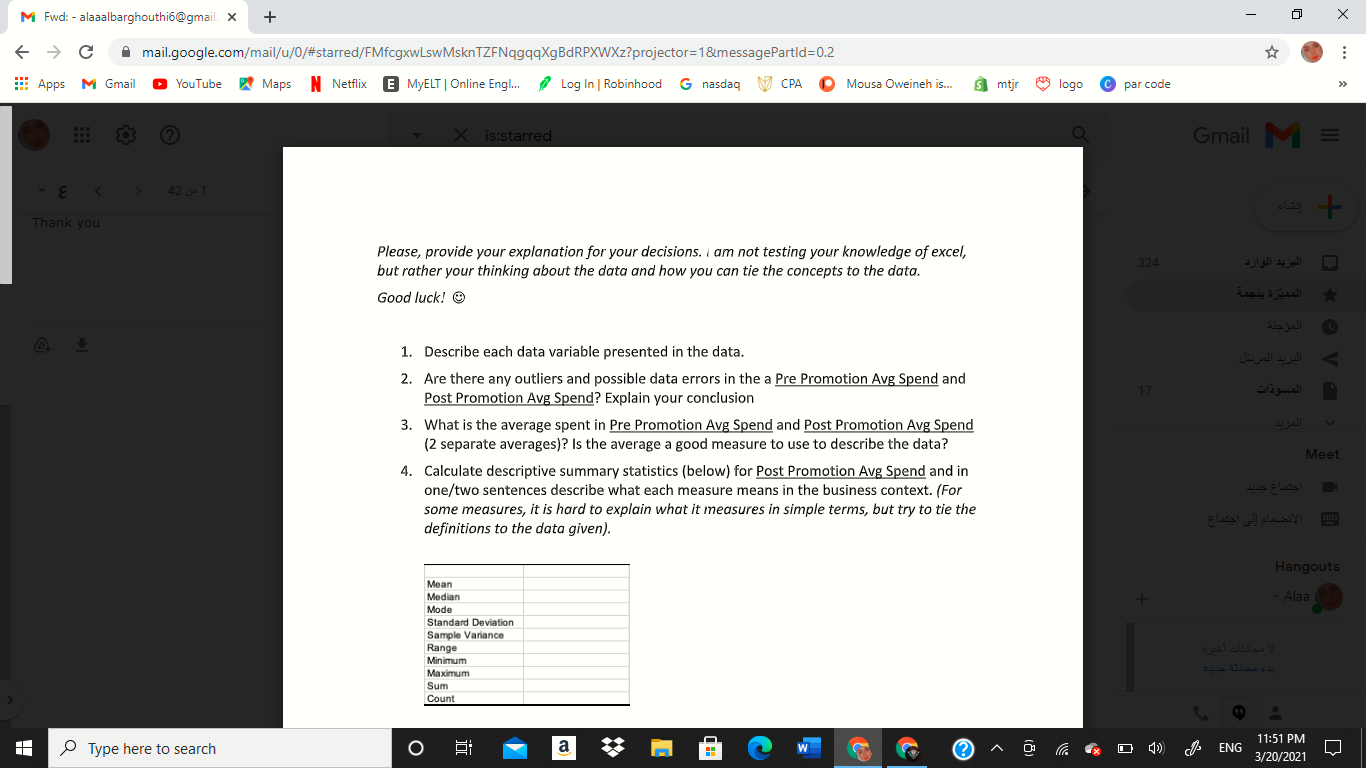
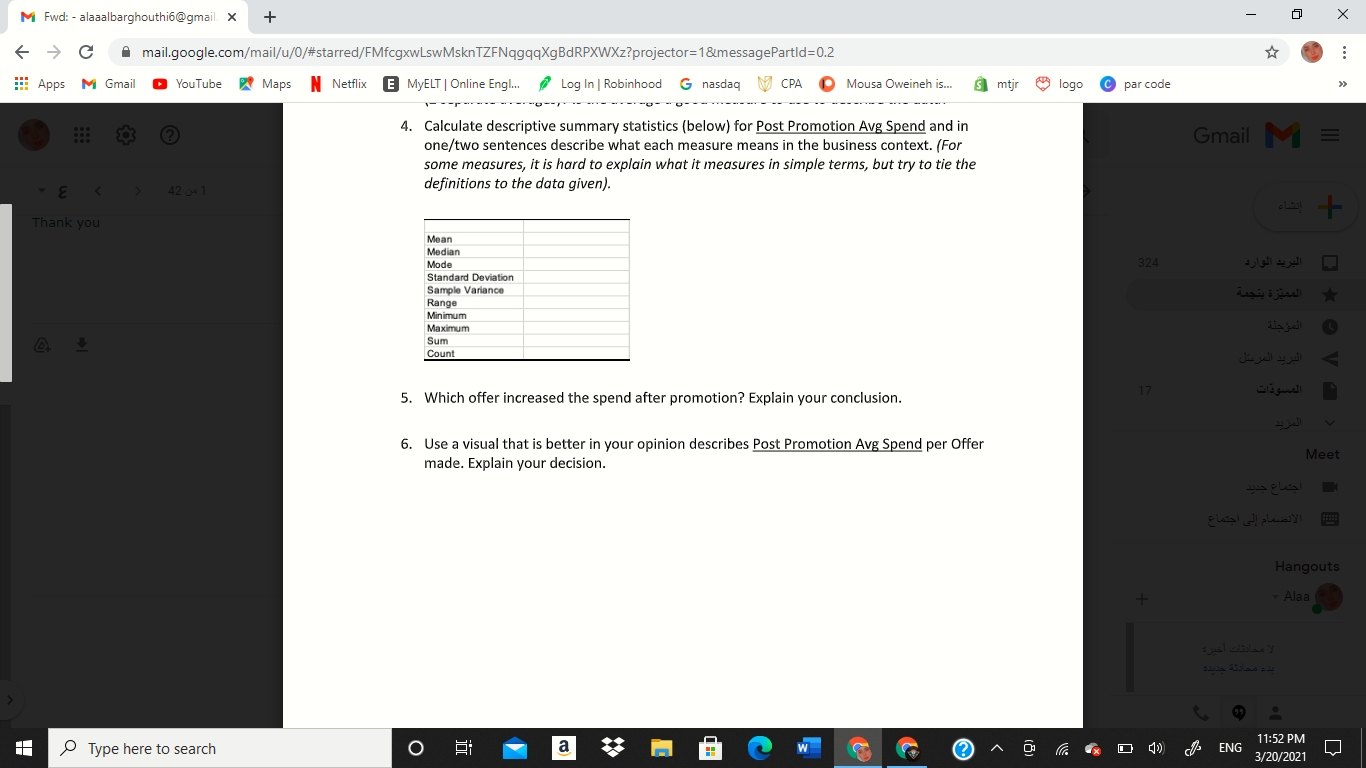
M Fwd: - alaaalbarghouthi6@gmail. x + X G mail.google.com/mail/u/0/#starred/FMfcgxwLswMsknTZFNqgqqXgBdRPXWXz?projector=1&messagePartld=0.2 . .. : Apps M Gmail @ YouTube 9 Maps N Netflix E MyELT | Online Engl... Log In | Robinhood G nasdaq CPA () Mousa Oweineh is... $|mtjr logo par code is:starred Gmail M E 42 0 1 Thank you Please, provide your explanation for your decisions. I am not testing your knowledge of excel, 324 but rather your thinking about the data and how you can tie the concepts to the data. Good luck! @ Als fell 4 1. Describe each data variable presented in the data. 2. Are there any outliers and possible data errors in the a Pre Promotion Avg Spend and 17 Post Promotion Avg Spend? Explain your conclusion 3. What is the average spent in Pre Promotion Avg Spend and Post Promotion Avg Spend V (2 separate averages)? Is the average a good measure to use to describe the data? Meet 4. Calculate descriptive summary statistics (below) for Post Promotion Avg Spend and in one/two sentences describe what each measure means in the business context. (For some measures, it is hard to explain what it measures in simple terms, but try to tie the definitions to the data given). Hangouts Mean Median Alaa Mode Standard Deviation Sample Variance Range Minimum Maximum Sum Count Type here to search 11:51 PM O a ENG 3/20/2021M Fwd: - alaaalbarghouthi6@gmail. x + X G mail.google.com/mail/u/0/#starred/FMfcgxwLswMsknTZFNqgqqXgBdRPXWXz?projector=1&messagePartld=0.2 . .. Apps M Gmail @ YouTube 9 Maps N Netflix E MyELT | Online Engl... Log In | Robinhood G nasdaq CPA () Mousa Oweinehis... $ mtjr logo par code 4. Calculate descriptive summary statistics (below) for Post Promotion Avg Spend and in one/two sentences describe what each measure means in the business context. (For Gmail M E some measures, it is hard to explain what it measures in simple terms, but try to tie the 42 0 1 definitions to the data given). Thank you Mean Median Mode 324 Standard Deviation Sample Variance Range Minimum Maximum Als fell 4 Sum Count 5. Which offer increased the spend after promotion? Explain your conclusion. 17 V 6. Use a visual that is better in your opinion describes Post Promotion Avg Spend per Offer Meet made. Explain your decision. Hangouts Alaa Type here to search O a ENG 11:52 PM 3/20/2021M Fwd: - alaaalbarghouthi6@gmail. x + X G mail.google.com/mail/u/0/#starred/FMfcgxwLswMsknTZFNqgqqXgBdRPXWXz?projector=1&messagePartld=0.2 . .. : Apps M Gmail @ YouTube 9 Maps N Netflix E MyELT | Online Engl... Log In | Robinhood G nasdaq CPA () Mousa Oweineh is... $|mtjr @ logo par code ANSWERS Gmail M E Q1 E 42 0 1 Scale=s ----- Nominal= N ------- Ordinal=0 Thank you AN BS CS 324 DS EO 4 FO Als fell GS HS IS 17 JO ko V LO Meet Q2 Three easy steps A) Calculate Quartiles B) Calculate Upper Hangouts C) Evaluate Result. Alaa + - 2 / 2 Asia Type here to search O a W ENG 11:52 PM 3/20/2021
Step by Step Solution
There are 3 Steps involved in it

Get step-by-step solutions from verified subject matter experts