

Question: The long - run Phillips curve This graph shows the long - run Phillips curve ( LRPC ) and several of the short - run
The longrun Phillips curve
This graph shows the longrun Phillips curve LRPC and several of the shortrun Phillips curves PC for an economy.
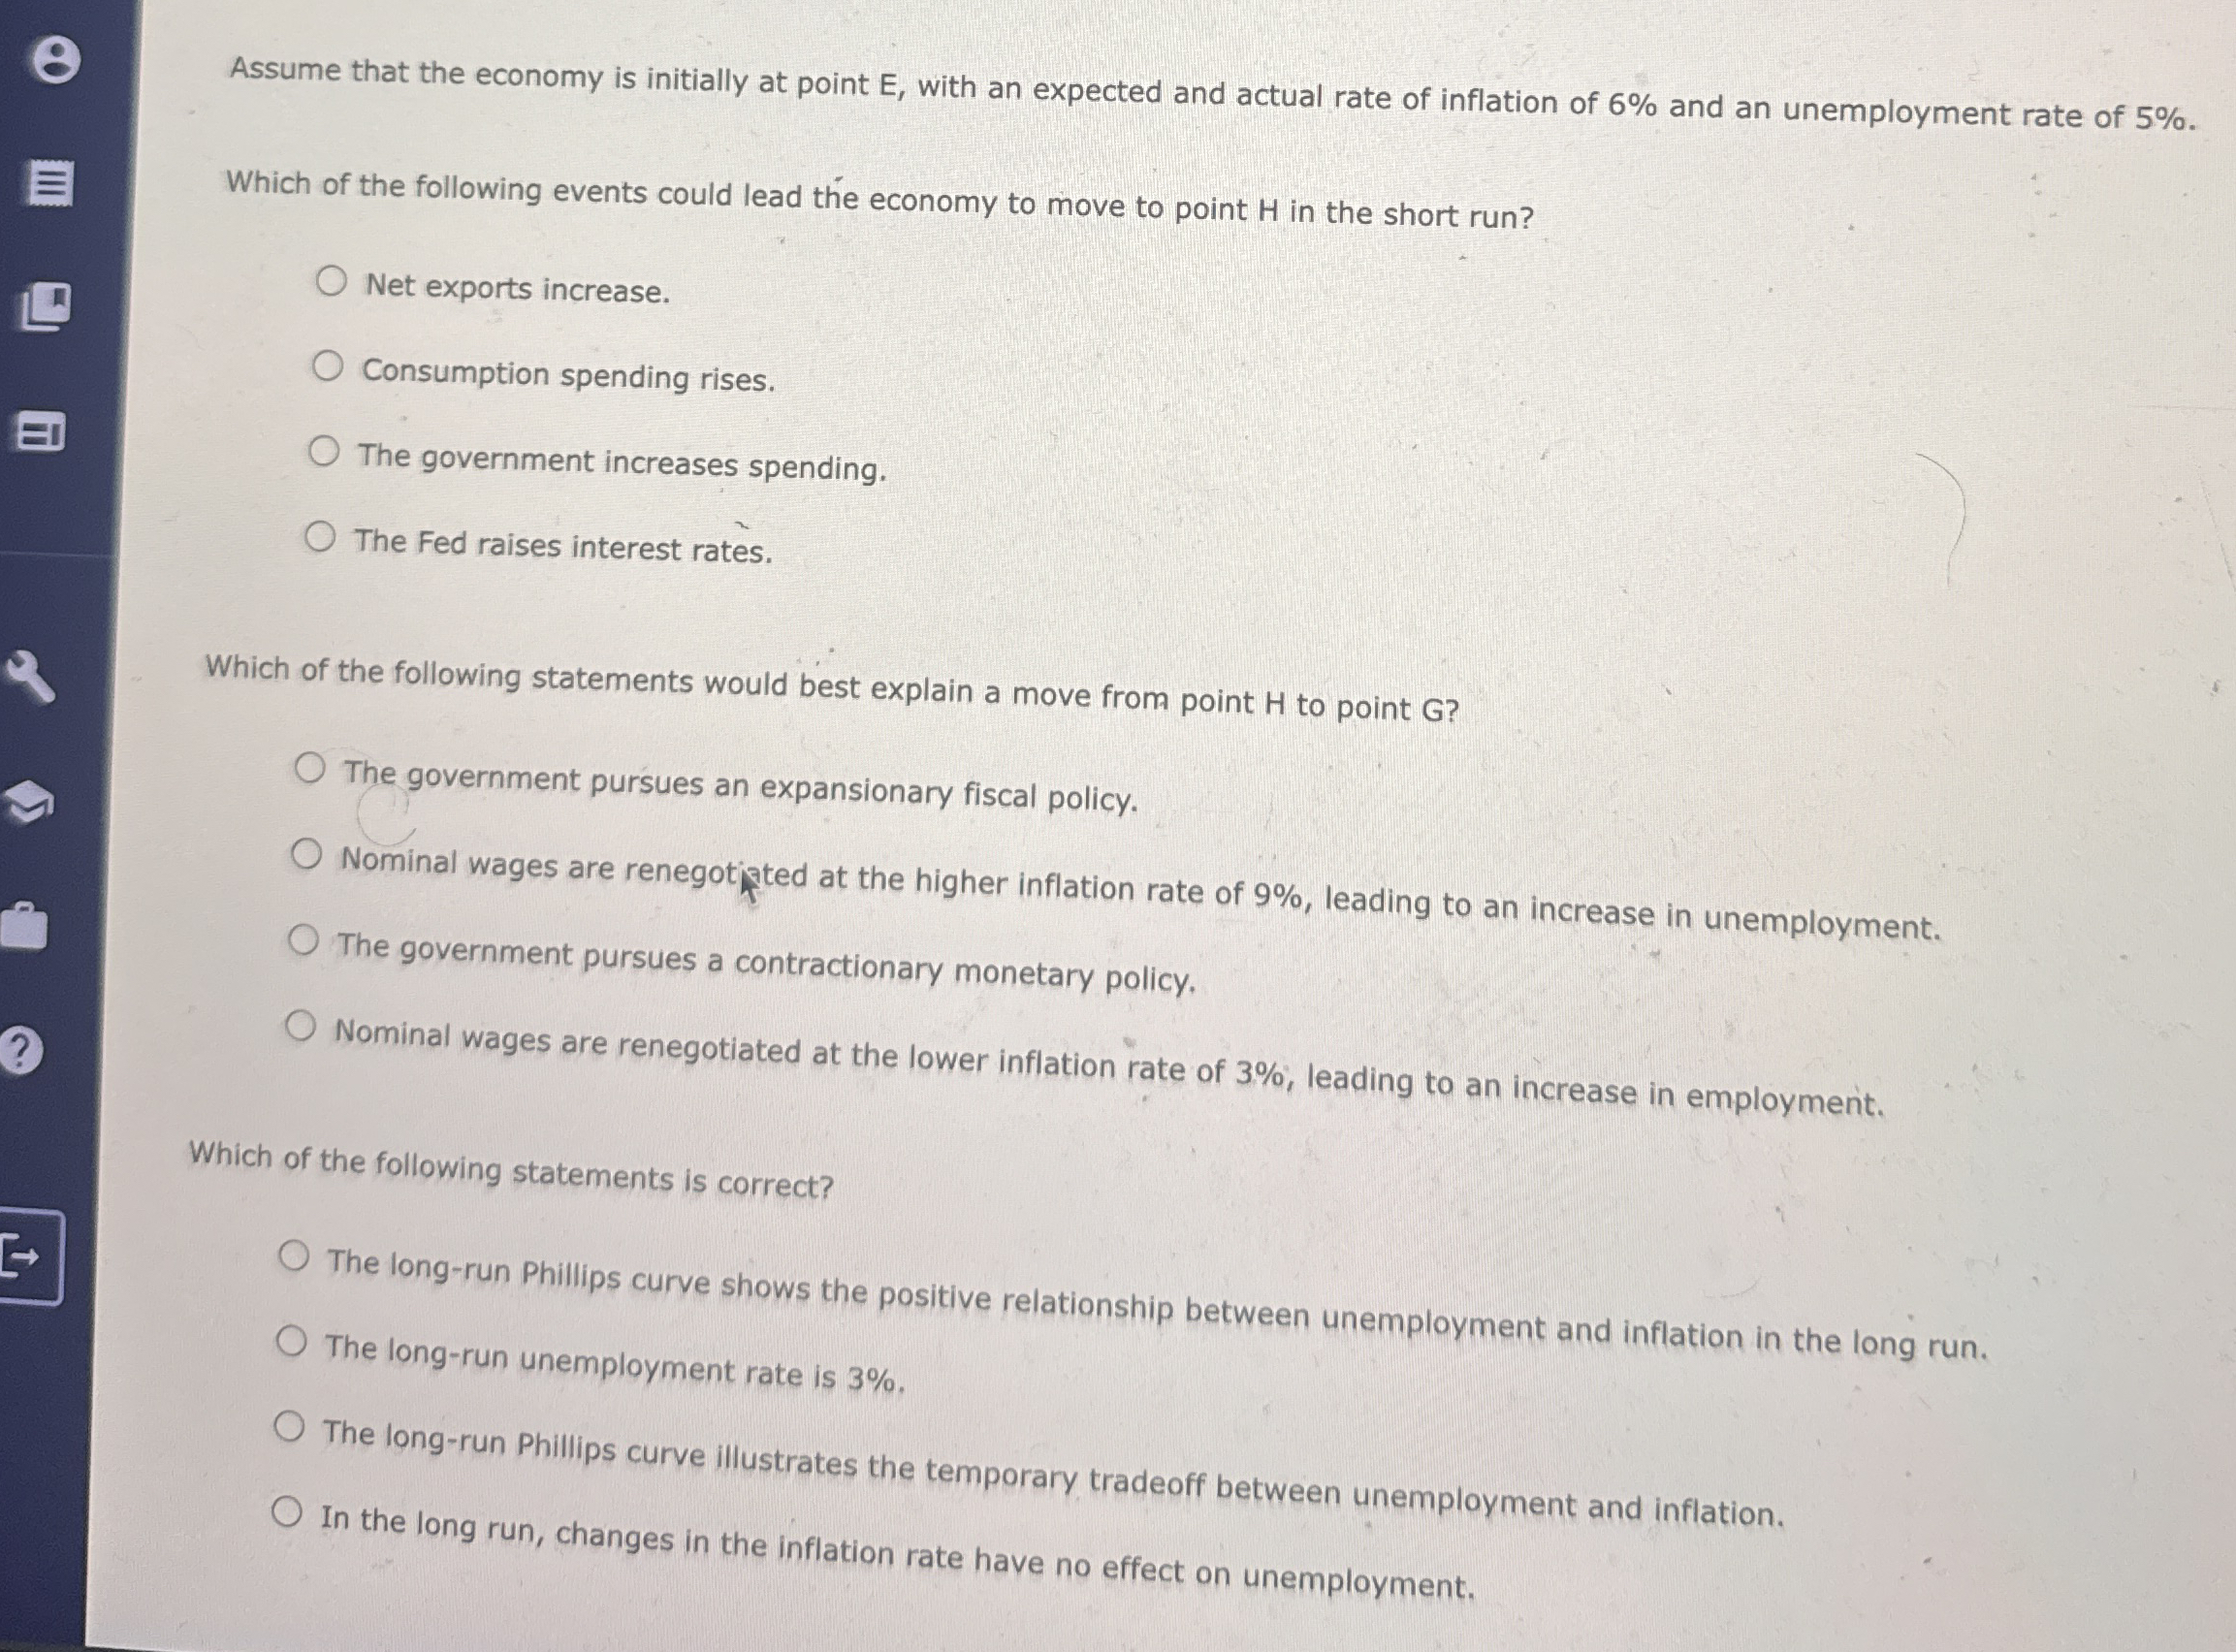
Assume that the economy is initially at point E with an expected and actual rate of inflation of and anemployment rate of
Which of the following events could lead the economy to move to point H in the short run?
Net exports increase.
Consumption spending rises.
The government increases spending.
The Fed raises interest rates.
Which of the following statements would best explain a move from point to point
The government pursues an expansionary fiscal policy.
Nominal wages are renegotiated at the higher inflation rate of leading to an increase in unemployment.
The government pursues a contractionary monetary policy.
Nominal wages are renegotiated at the lower inflation rate of leading to an increase in employment.
Which of the following statements is correct?
The longrun Phillips curve shows the positive relationship between unemployment and inflation in the long run.
The longrun unemployment rate is
The longrun Phillips curve illustrates the temporary tradeoff between unemployment and inflation.
In the long run, changes in the inflation rate have no effect on unemployment.
Step by Step Solution
There are 3 Steps involved in it
1 Expert Approved Answer
Step: 1 Unlock

Question Has Been Solved by an Expert!
Get step-by-step solutions from verified subject matter experts
Step: 2 Unlock
Step: 3 Unlock