

Question: the macro created in step f. 5. Charting: (30 points) Use the data in the Industry X table to create a chart similar to this
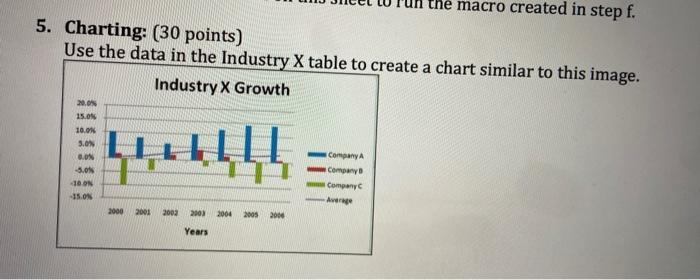
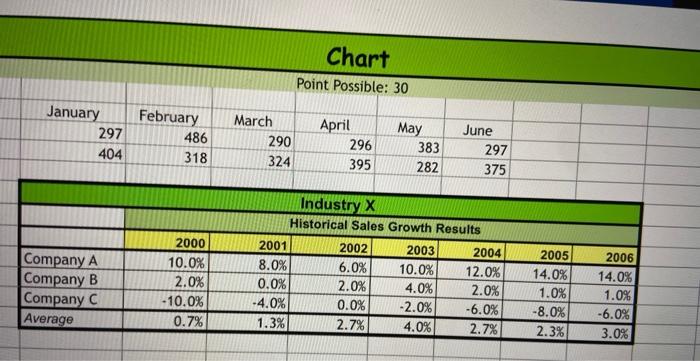
the macro created in step f. 5. Charting: (30 points) Use the data in the Industry X table to create a chart similar to this image. Industry X Growth 200 15.0% 10.05 3.0 0DN -3.05 -10. ON -15.0N LLLL Company Company Company Ar 2000 2001 2003 2003 2004 2005 2006 Years Chart Point Possible: 30 January 297 404 February 486 318 March 290 324 April 296 May June 297 375 383 282 395 Industry X Historical Sales Growth Results Company A Company B Company C Average 2000 10.0% 2.0% -10.0% 0.7% 2001 8.0% 0.0% -4.0% 1.3% 2002 6.0% 2.0% 0.0% 2.7% 2003 10.0% 4.0% -2.0% 4.0% 2004 12.0% 2.0% -6.0% 2.7% 2005 14.0% 1.0% -8.0% 2.3% 2006 14.0% 1.0% -6.0% 3.0%
Step by Step Solution
There are 3 Steps involved in it

Get step-by-step solutions from verified subject matter experts