

Question: The main objectives for this project and the presentation are: 1. To familiarize yourselves with basic option trading strategies 2. To leam how to construct
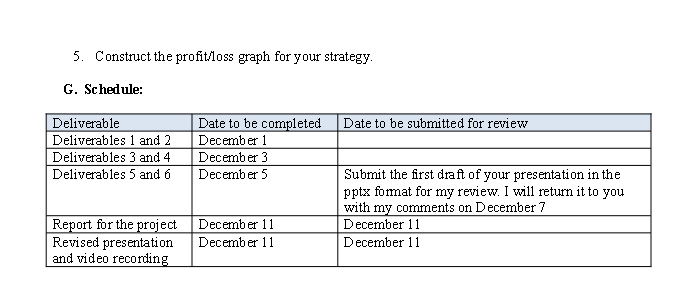
The main objectives for this project and the presentation are: 1. To familiarize yourselves with basic option trading strategies 2. To leam how to construct a payoff and profit/loss tables and a payoff and profit/loss diagrams for a simple option trading strategy 3. To understand reasons for using an option trading strategy 4. To apply the Black Scholes option pricing formula to price constituent options D. Software Requirements You will need to use Excel for your calculations. E. Data: 1. Choose a stock that you wish to work with and download data on the most recent price and the volatility estimated for this stock. 2. From Bloomberg, download prices (inclusive of dividends) for your stock for the most recent 500 days. 3. From Bloomberg, download the yield to maturity on the Treasury bill (zero-coup on bond issued by the US govemment) that will mature in three months from the date when you obtain all data. F. Deliverables: Deliverable 1 - Bloomberg screenshots 1. Obtain Bloomberg screenshots showing the following: a. The most recent price of the chosen stock b. The most recent estimate of the volatility (standard deviation of returns) on your stock c. The most recent estimate of the yield to maturity (YTM) on the Treasury bill that will mature in approximately three months from the date that you download all your data. You will need to submit these screenshots in the Appendix of your project report and incorporate them into your presentation slides. Deliverable 2 - Estimating the historical volatility of returns on the underlying stock: 1. Using 500 prices (adjusted for dividends), which you downloaded from Bloomberg, calculate daily returns on your stock using formula: rt,t+1=StSt+1St where St is the price on day t. 2. Use the sample standard deviation function in Excel to calculate historical daily volatility of returns on your stock. Since you used daily price data, this is the volatility per day. Annualize it. 3. Report the annualized volatility of returns on your stock and compare your estimate with the volatility obtained from Bloomberg. Deliverable 3 - Setting up options used in the strategy: 1. Describe options used in your strategy. 2. Choose strike prices for each option and explain your choice. 3. Choose the time to expiration between 3 months and 1 year. Explain your choice. Deliverable 4 - The payo ff table and the payoff graph: 1. Construct the payo ff table for your strategy. Each column of your table should represent "a state" and each row - an asset: a. You will have as many states (columns) as there are different strike prices for options in your strategy plus one more state. b. You will have as many rows as there are different assets used in your strategy plus one more row, where you will calculate the total payoff for your strategy. 2. Use the last row of the payoff table that shows the total pay off of the strategy to construct the graph of the total payoff for your strategy. 3. In your report and presentation, present the payoff table and the associated graph of the total payoff of your strategy. Deliverable 5 - Calculating prices of options using the Black Scholes Option Pricing Model: 1. For each option in the strategy, substitute the five inputs, i.e. the current stock price (S), the strike price (E), the annualized volatility of retums on the stock (), the annualized risk-free rate (rf), and the time to expiration expressed in annual terms (T) into the B lack Scholes formula to calculate the option's price. 2. In your report and presentation, show details of these calculations, using regular (NOT Excel) formulas. First, write necessary formulas using symbols and then present the same formulas with the numerical values of the five parameters plugged into them. Deliverable 6 - Break-even points, maximum pro fit and loss calculations: 1. Using prices of options from Deliverable 5, calculate the cost of the strategy. 2. Find the breakeven points for the strategy. This means that you need to calculate the prices of the underlying stock, at which your strategy results in zero profit/loss. 3. Find the maximum profit for your strategy and indicate the range of prices at which you can eam this maximum profit. 4. Find the maximum loss for your strategy and indicate the range of prices at which the strategy will experience this maximum loss. 5. Construct the profit/loss graph for your strategy. G. Schedule
Step by Step Solution
There are 3 Steps involved in it

Get step-by-step solutions from verified subject matter experts