

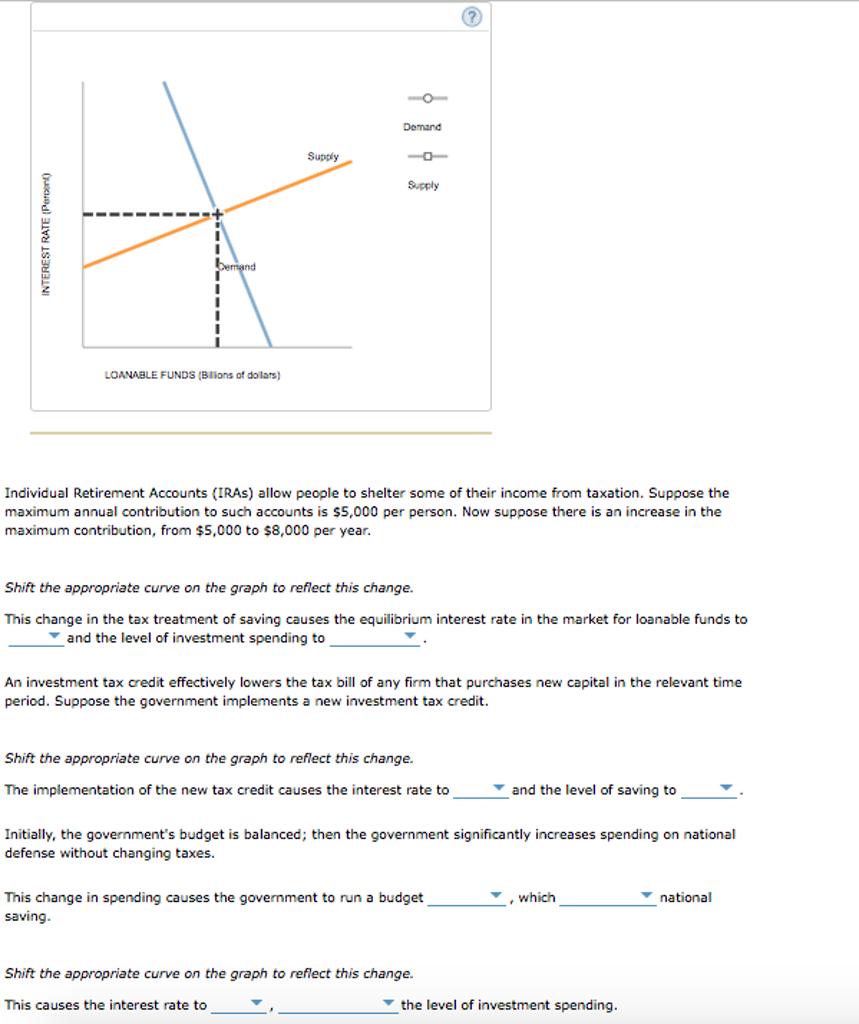
The following graph shows the market for loanable funds. For each of the given scenarios, adjust the
Fantastic news! We've Found the answer you've been seeking!
Question:
The following graph shows the market for loanable funds. For each of the given scenarios, adjust the appropriate curve on the graph to help you complete the questions that follow. Treat each scenario separately by resetting the graph to its original state before examining the effect of each individual scenario. (Note: You will not be graded on any changes you make to the graph.)
Expert Answer:

Related Book For 

Posted Date:
