

Question: the maths is statistics statical process control Instructions You may use this data to complete parts two and three of the course project. For part
the maths is statistics statical process control
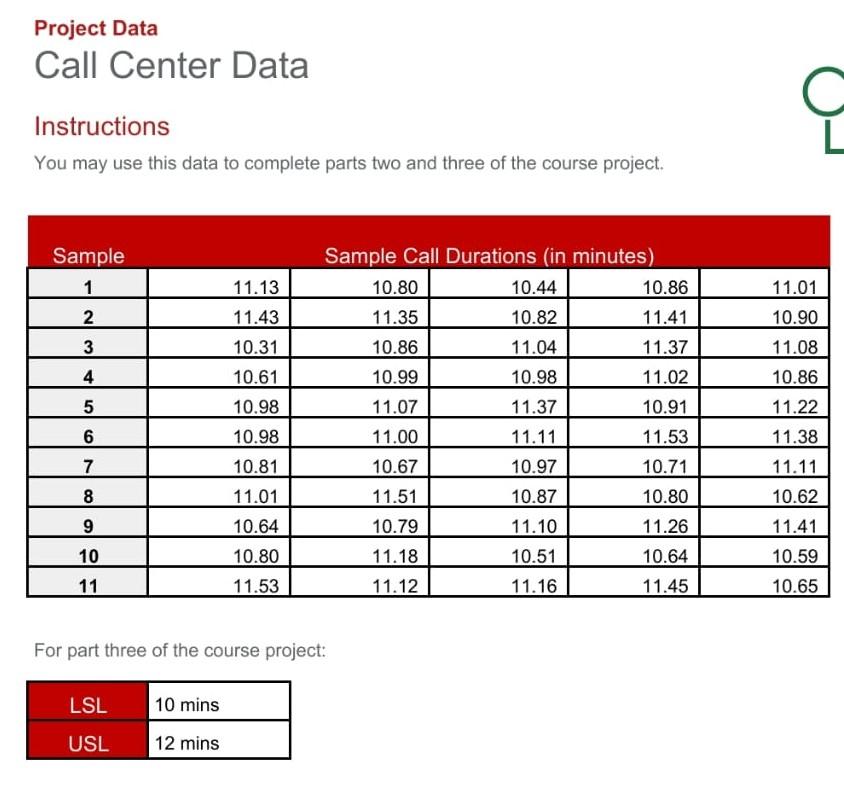
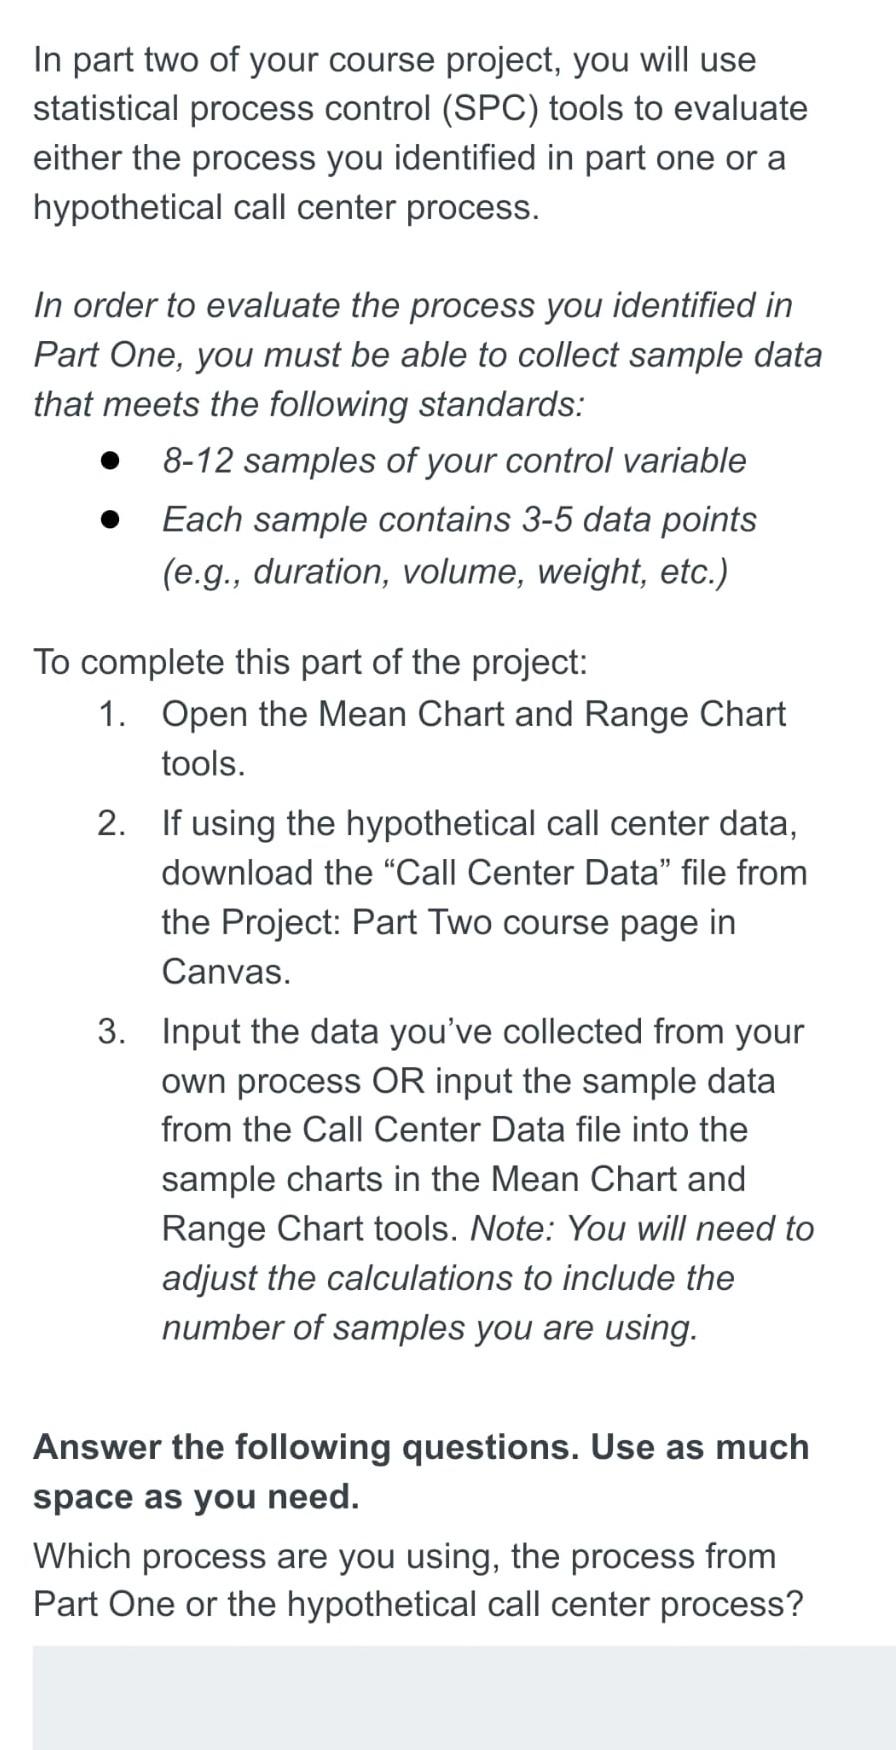
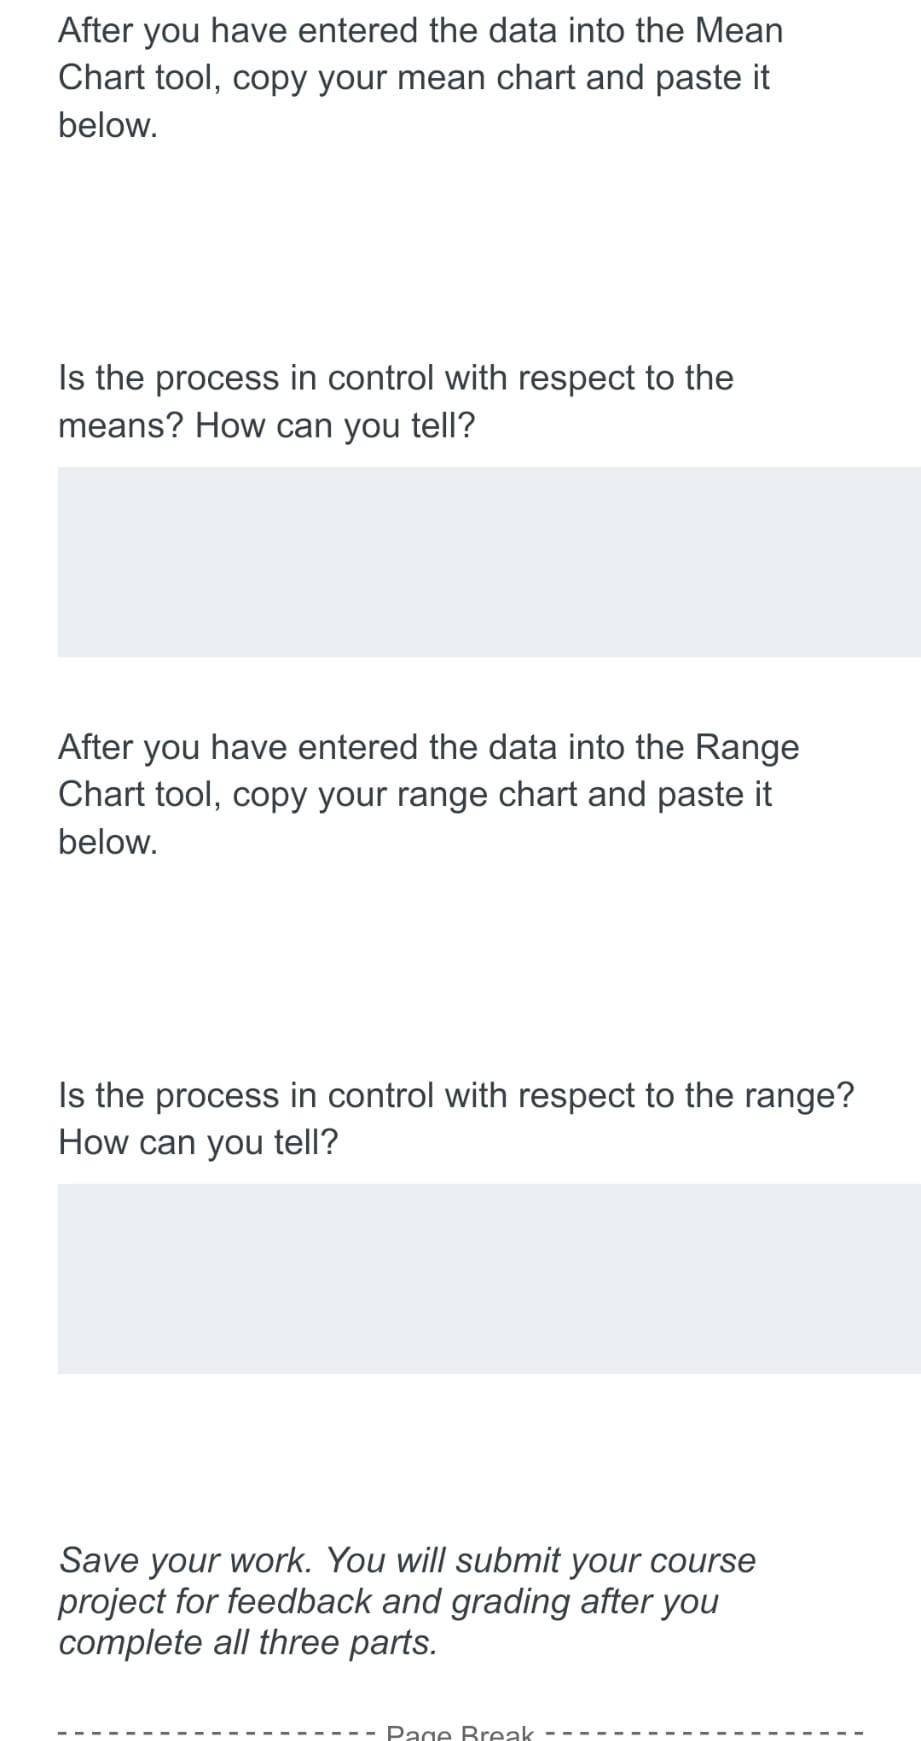
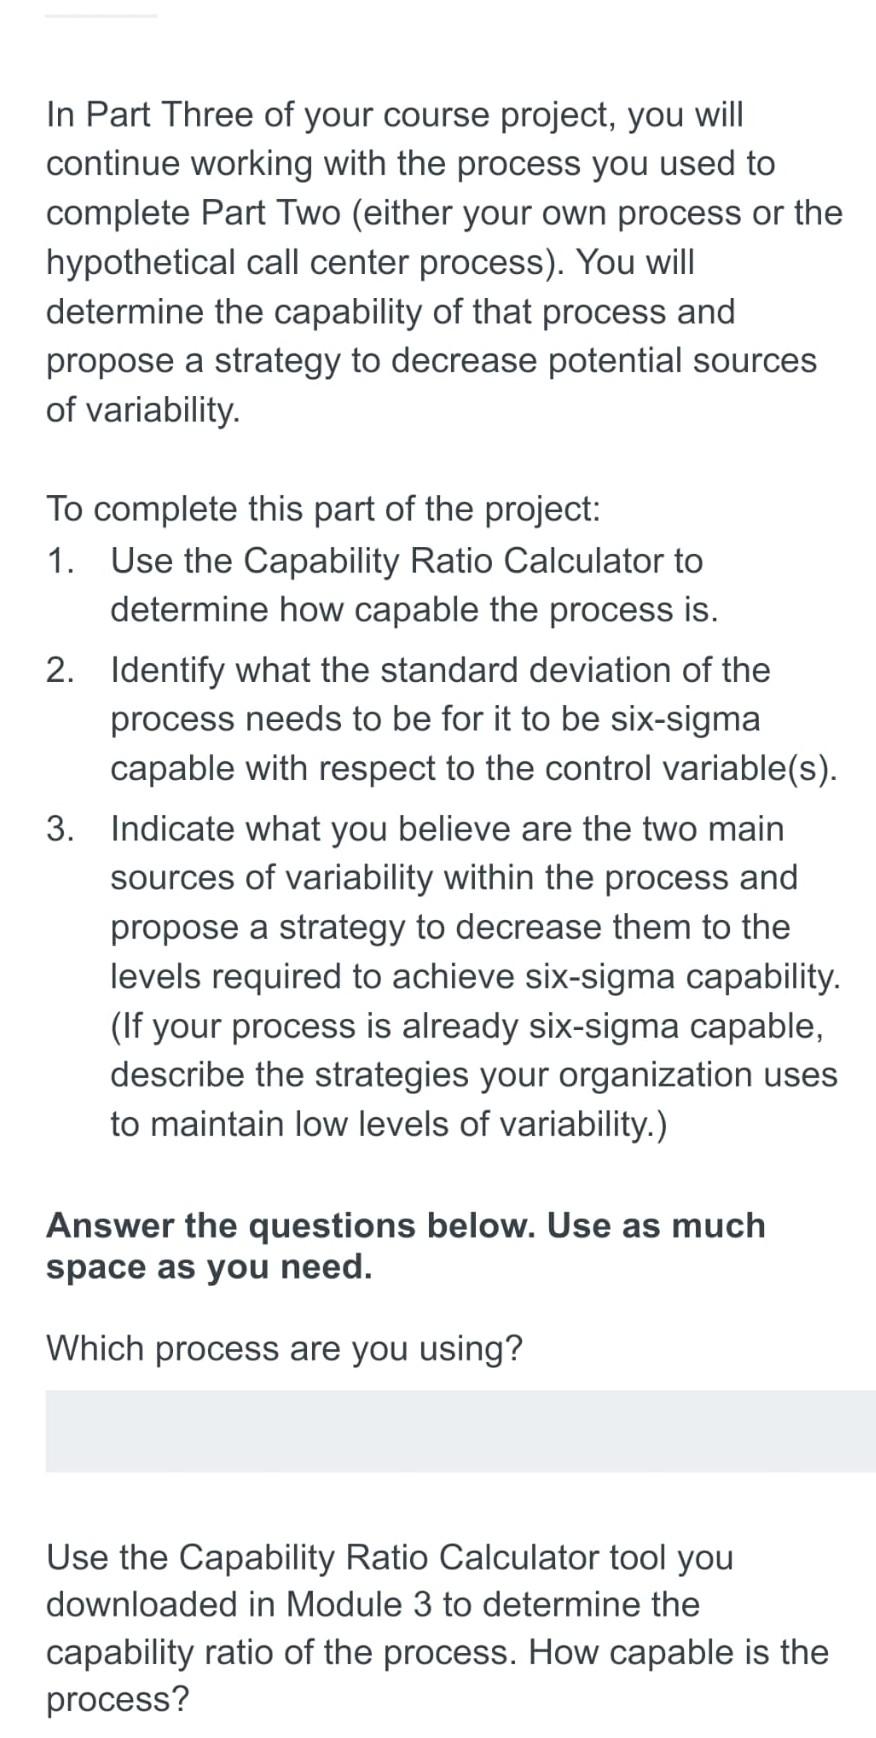
Instructions You may use this data to complete parts two and three of the course project. For part three of the course project: If it is not six-sigma capable, what does the standard deviation of the process need to be for it to be six-sigma capable with respect to the control variable(s)? What do you believe are the two main sources of variability within the process? List them in the table below and propose a strategy to decrease them to the levels required to achieve six-sigma capability. If your process is already six-sigma capable, describe the strategies your organization uses to maintain low levels of variability. In part two of your course project, you will use statistical process control (SPC) tools to evaluate either the process you identified in part one or a hypothetical call center process. In order to evaluate the process you identified in Part One, you must be able to collect sample data that meets the following standards: - 8-12 samples of your control variable - Each sample contains 3-5 data points (e.g., duration, volume, weight, etc.) To complete this part of the project: 1. Open the Mean Chart and Range Chart tools. 2. If using the hypothetical call center data, download the "Call Center Data" file from the Project: Part Two course page in Canvas. 3. Input the data you've collected from your own process OR input the sample data from the Call Center Data file into the sample charts in the Mean Chart and Range Chart tools. Note: You will need to adjust the calculations to include the number of samples you are using. Answer the following questions. Use as much space as you need. Which process are you using, the process from Part One or the hypothetical call center process? After you have entered the data into the Mean Chart tool, copy your mean chart and paste it below. Is the process in control with respect to the means? How can you tell? After you have entered the data into the Range Chart tool, copy your range chart and paste it below. Is the process in control with respect to the range? How can you tell? Save your work. You will submit your course project for feedback and grading after you complete all three parts. What do you believe are the two main sources of variability within the process? List them in the table below and propose a strategy to decrease them to the levels required to achieve six-sigma capability. If your process is already six-sigma capable, describe the strategies your organization uses to maintain low levels of variability. In Part Three of your course project, you will continue working with the process you used to complete Part Two (either your own process or the hypothetical call center process). You will determine the capability of that process and propose a strategy to decrease potential sources of variability. To complete this part of the project: 1. Use the Capability Ratio Calculator to determine how capable the process is. 2. Identify what the standard deviation of the process needs to be for it to be six-sigma capable with respect to the control variable(s). 3. Indicate what you believe are the two main sources of variability within the process and propose a strategy to decrease them to the levels required to achieve six-sigma capability. (If your process is already six-sigma capable, describe the strategies your organization uses to maintain low levels of variability.) Answer the questions below. Use as much space as you need. Which process are you using? Use the Capability Ratio Calculator tool you downloaded in Module 3 to determine the capability ratio of the process. How capable is the process
Step by Step Solution
There are 3 Steps involved in it

Get step-by-step solutions from verified subject matter experts