

Question: The matlab code given creates the first figure, and I need to use matlab to take the ctrs and turn into two different data sets
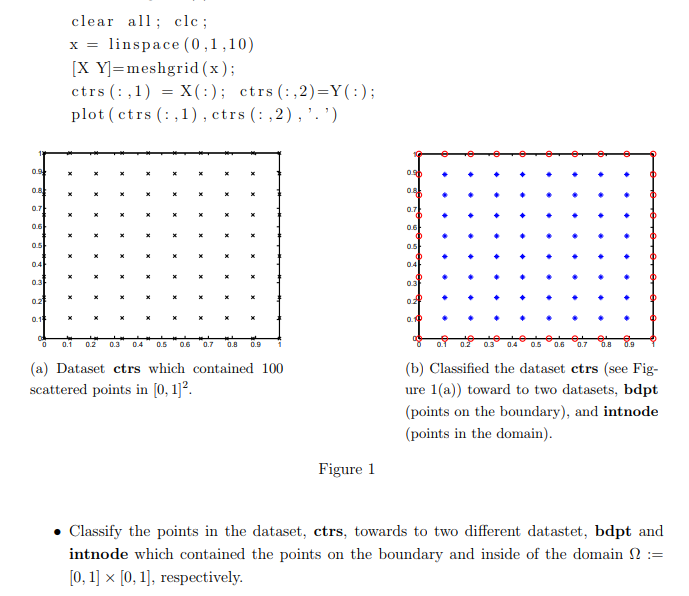 The matlab code given creates the first figure, and I need to use matlab to take the ctrs and turn into two different data sets and put the ones on the boundry into bdpt and the ones in the internal part of the grid into intnode.
clear al cl; x linspace (0,1,10) X Y-meshgrid (x) ctrs (: , 1 ) = X( : ) ; ctrs (: ,2)=Y( : ) ; plot (ctrs (:1), ctrs (: ,2), '.') 0.7 0.6 0.3 0.1 0.2 0.3 04 0.5 06 0.70.8 0.9 1 03 0.4 05 06 0.7 (a) Dataset ctrs which contained 100 (b) Classified the dataset ctrs (see Fig ure 1(a)) toward to two datasets, bdpt (points on the boundary), and intnode (points in the domain) scattered points in [0, 1]2 Figure 1 Classify the points in the dataset, ctrs, towards to two different datastet, bdpt and intnode which contained the points on the boundary and inside of the domain 2:- (0, 1] x [0, 1], respectively
Step by Step Solution
There are 3 Steps involved in it

Get step-by-step solutions from verified subject matter experts