

Question: The Matlab This is my function file function [I1,S1,R1,N1] = DiseaseSteptogether(I,h,a,S,N,b,R) %UNTITLED4 Summary of this function goes here % Detailed explanation goes here I1= I+(h.*(((a.*S.*I)./N)-(I/b)));
The Matlab
![The Matlab This is my function file function [I1,S1,R1,N1] = DiseaseSteptogether(I,h,a,S,N,b,R) %UNTITLED4](https://s3.amazonaws.com/si.experts.images/answers/2024/08/66ac93cca5a1a_06066ac93cc1a5de.jpg)
This is my function file
function [I1,S1,R1,N1] = DiseaseSteptogether(I,h,a,S,N,b,R)
%UNTITLED4 Summary of this function goes here
% Detailed explanation goes here
I1= I+(h.*(((a.*S.*I)./N)-(I/b)));
S1= S+(h.*((-a.*S.*I)./N));
R1=R+(h.*(I/b));
N1=S1+I1+R1;
end
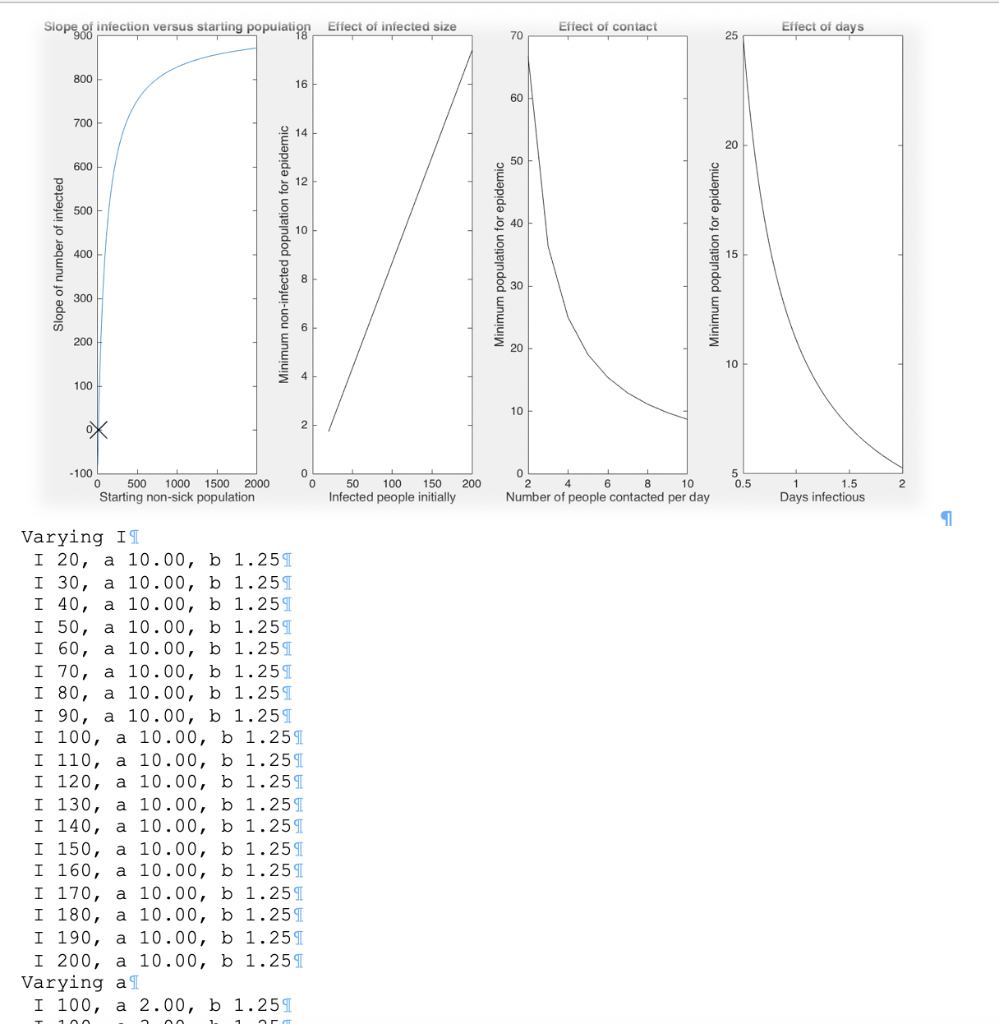
Equations We can model what happens over time using ordinary differential equations -these are equations that say how a given value (eg, S, I, and R) change if you take a small step forward in time. 1 . How s changes : dt=-T o How I changes: Changes: as dI asI e How I changes:-- I/b =- dt N dR How R changes: a-1/b Total population: N S+I+R1 o Assume no births or deaths, so N always stays the same.l We can approximate how S, I, and R change by taking a small step h (in days) forward in time. If So is the starting value for S, then after h time S1 is approximately: S1 -So + h dt Use the same type of calculations for R and i (e.g. R1 = Ro +, 1,-10 + h, After calculating new values for S, I, and R, dS you can repeat the calculations to find the values at the next time step: S2 Sh Remmber: To calculate the second step (S2) you need to use the values from the previous step (S1, R1, l1). The table below demonstrates the manual calculation for S.1 Initial values1 a = 101 b 1.25 R 0 (no one's recovered yet)T l 100 (100 people have been infected) h = 0.05 days Determine what starting population is needed to start an epidemic. What you need: A function (FindEpidemic) that is positive when the starting population is big enough, negative when it isn't. If you look at the infected plots, the starting slope of the red line (no epidemic) is negative, while all of the others are positive. function [ fzeroValue l FindEpidemicl SStart, IStart, a, b ) The slope at the start can be found by taking one time step (f(x+h) - f(x)) / h. Use DiseaseStep (or DiseaseSimulate) to calculate f(x) and f(xtb) for the infected value after one time step. 1 To-do:1I 1. Write the FindEpidemic function above.1 2. Use FindEpidemic and fzero to find the zero location. T 3. Plot the function (leftmost window in self-check) to check it. 4. Print out the actual starting non-infected population value .1 Implementation note: fzero takes one parameter. Use an anonymous function to bind lStart, a, and b and let s vary. T * *Use your guess from part 5 as the starting value for fzero. T Extra credit [20 pts each] (windows 2-4 in self-check): See how the number of susceptible people needed changes as you vary a and b: Initial infected population (20-200), a (2-10), and b (0.5-2). Use 10 as your starting value for fzero; it's a bit finicky and you may get NaN answers otherwise.T Self-Check:l Smallest starting population that results in an epidemic: x Extra credit below (it's a little long).u siopse iniection versus starting popuiau n Etiect infected size Effect of contact Effect of days 70 25 16 12 500 10 15 300 10 100 10 100 5 0.5 1.5 0 500 1000 1500 2000 Starting non-sick population 50 100 150 200 Infected people initially 10 Number of people contacted per day Days infectious Varying IT I 20, a 10.00, b 1.25S I 30, a 10.00, b 1.25S I 40, a 10.00, b 1.259 I 50, a 10.00, b 1.259 I 60, a 10.00, b 1.25S I 70, a 10.00, b 1.25S I 80, a 10.00, b 1.25S I 90, a 10.00, b 1.25S I 100, a 10.00, b 1.25 I 110, a 10.00, b 1.25 I 120, a 10.00, b 1.25T I 130, a 10.00, b 1.25T I 140, a 10.00, b 1.25 I 150, a 10.00, b 1.25 I 160, a 10.00, b 1.25S I 170, a 10.00, b 1.25S I 180, a 10.00, b 1.25ST I 190, a 10.00, b 1.25ST I 200, a 10.00, b 1.25T Varying ag I 100, a 2.00, b 1.259 Equations We can model what happens over time using ordinary differential equations -these are equations that say how a given value (eg, S, I, and R) change if you take a small step forward in time. 1 . How s changes : dt=-T o How I changes: Changes: as dI asI e How I changes:-- I/b =- dt N dR How R changes: a-1/b Total population: N S+I+R1 o Assume no births or deaths, so N always stays the same.l We can approximate how S, I, and R change by taking a small step h (in days) forward in time. If So is the starting value for S, then after h time S1 is approximately: S1 -So + h dt Use the same type of calculations for R and i (e.g. R1 = Ro +, 1,-10 + h, After calculating new values for S, I, and R, dS you can repeat the calculations to find the values at the next time step: S2 Sh Remmber: To calculate the second step (S2) you need to use the values from the previous step (S1, R1, l1). The table below demonstrates the manual calculation for S.1 Initial values1 a = 101 b 1.25 R 0 (no one's recovered yet)T l 100 (100 people have been infected) h = 0.05 days Determine what starting population is needed to start an epidemic. What you need: A function (FindEpidemic) that is positive when the starting population is big enough, negative when it isn't. If you look at the infected plots, the starting slope of the red line (no epidemic) is negative, while all of the others are positive. function [ fzeroValue l FindEpidemicl SStart, IStart, a, b ) The slope at the start can be found by taking one time step (f(x+h) - f(x)) / h. Use DiseaseStep (or DiseaseSimulate) to calculate f(x) and f(xtb) for the infected value after one time step. 1 To-do:1I 1. Write the FindEpidemic function above.1 2. Use FindEpidemic and fzero to find the zero location. T 3. Plot the function (leftmost window in self-check) to check it. 4. Print out the actual starting non-infected population value .1 Implementation note: fzero takes one parameter. Use an anonymous function to bind lStart, a, and b and let s vary. T * *Use your guess from part 5 as the starting value for fzero. T Extra credit [20 pts each] (windows 2-4 in self-check): See how the number of susceptible people needed changes as you vary a and b: Initial infected population (20-200), a (2-10), and b (0.5-2). Use 10 as your starting value for fzero; it's a bit finicky and you may get NaN answers otherwise.T Self-Check:l Smallest starting population that results in an epidemic: x Extra credit below (it's a little long).u siopse iniection versus starting popuiau n Etiect infected size Effect of contact Effect of days 70 25 16 12 500 10 15 300 10 100 10 100 5 0.5 1.5 0 500 1000 1500 2000 Starting non-sick population 50 100 150 200 Infected people initially 10 Number of people contacted per day Days infectious Varying IT I 20, a 10.00, b 1.25S I 30, a 10.00, b 1.25S I 40, a 10.00, b 1.259 I 50, a 10.00, b 1.259 I 60, a 10.00, b 1.25S I 70, a 10.00, b 1.25S I 80, a 10.00, b 1.25S I 90, a 10.00, b 1.25S I 100, a 10.00, b 1.25 I 110, a 10.00, b 1.25 I 120, a 10.00, b 1.25T I 130, a 10.00, b 1.25T I 140, a 10.00, b 1.25 I 150, a 10.00, b 1.25 I 160, a 10.00, b 1.25S I 170, a 10.00, b 1.25S I 180, a 10.00, b 1.25ST I 190, a 10.00, b 1.25ST I 200, a 10.00, b 1.25T Varying ag I 100, a 2.00, b 1.259
Step by Step Solution
There are 3 Steps involved in it

Get step-by-step solutions from verified subject matter experts