

Question: The mean absolute percentage error ( MAPE ) for the forecasts shown in the following table is: table [ [ Month , Forecast Demand,Actual
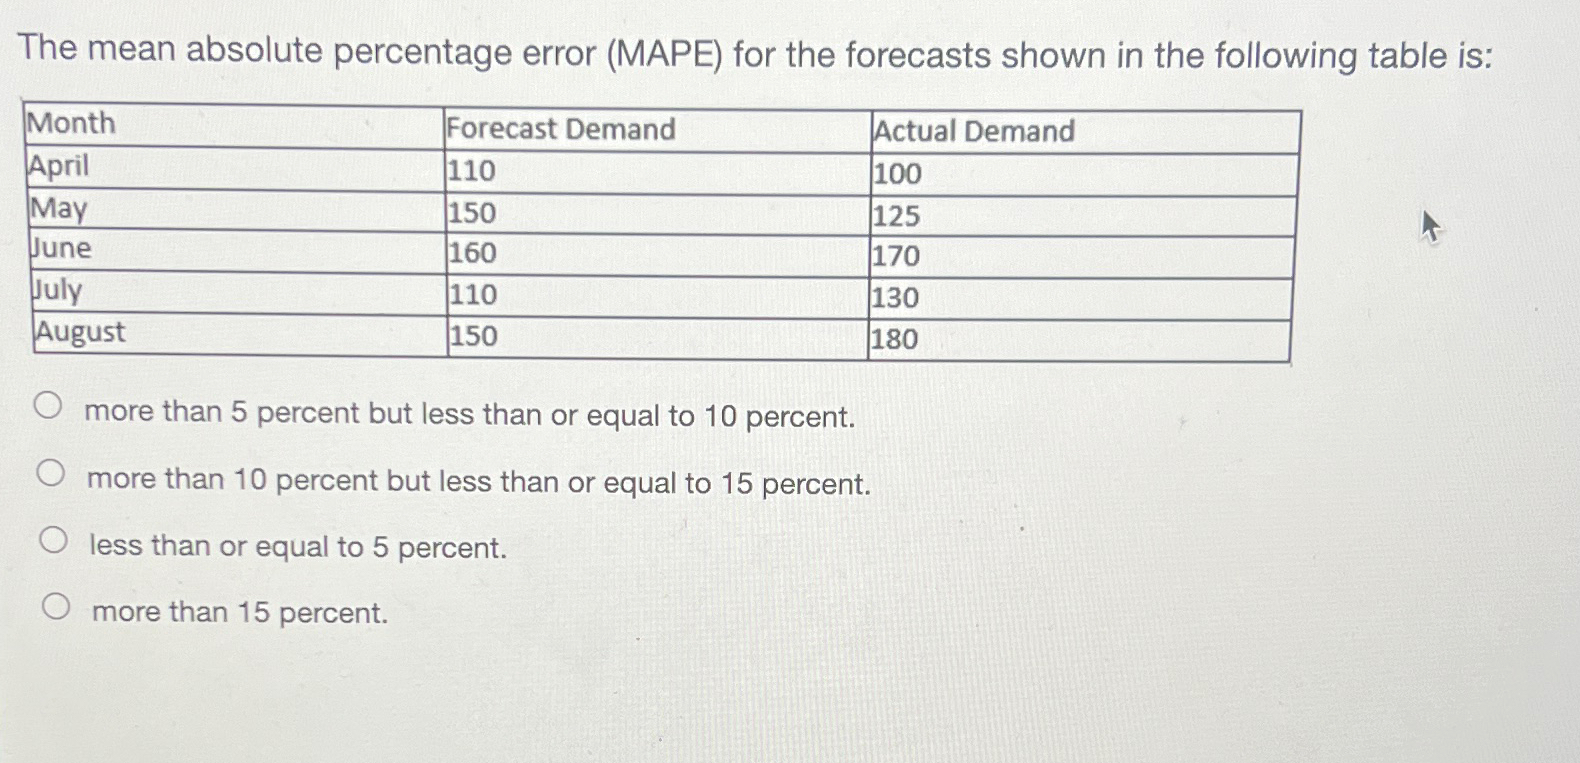
The mean absolute percentage error MAPE for the forecasts shown in the following table is:
tableMonthForecast Demand,Actual DemandAprilMayJuneJulyAugust
more than percent but less than or equal to percent.
more than percent but less than or equal to percent.
less than or equal to percent.
more than percent.
Step by Step Solution
There are 3 Steps involved in it
1 Expert Approved Answer
Step: 1 Unlock

Question Has Been Solved by an Expert!
Get step-by-step solutions from verified subject matter experts
Step: 2 Unlock
Step: 3 Unlock