

Question: The mean SAT Math section score for 2017 was 26 with a standard deviation of 5. Assume the SAT Math section scores are normally distributed.
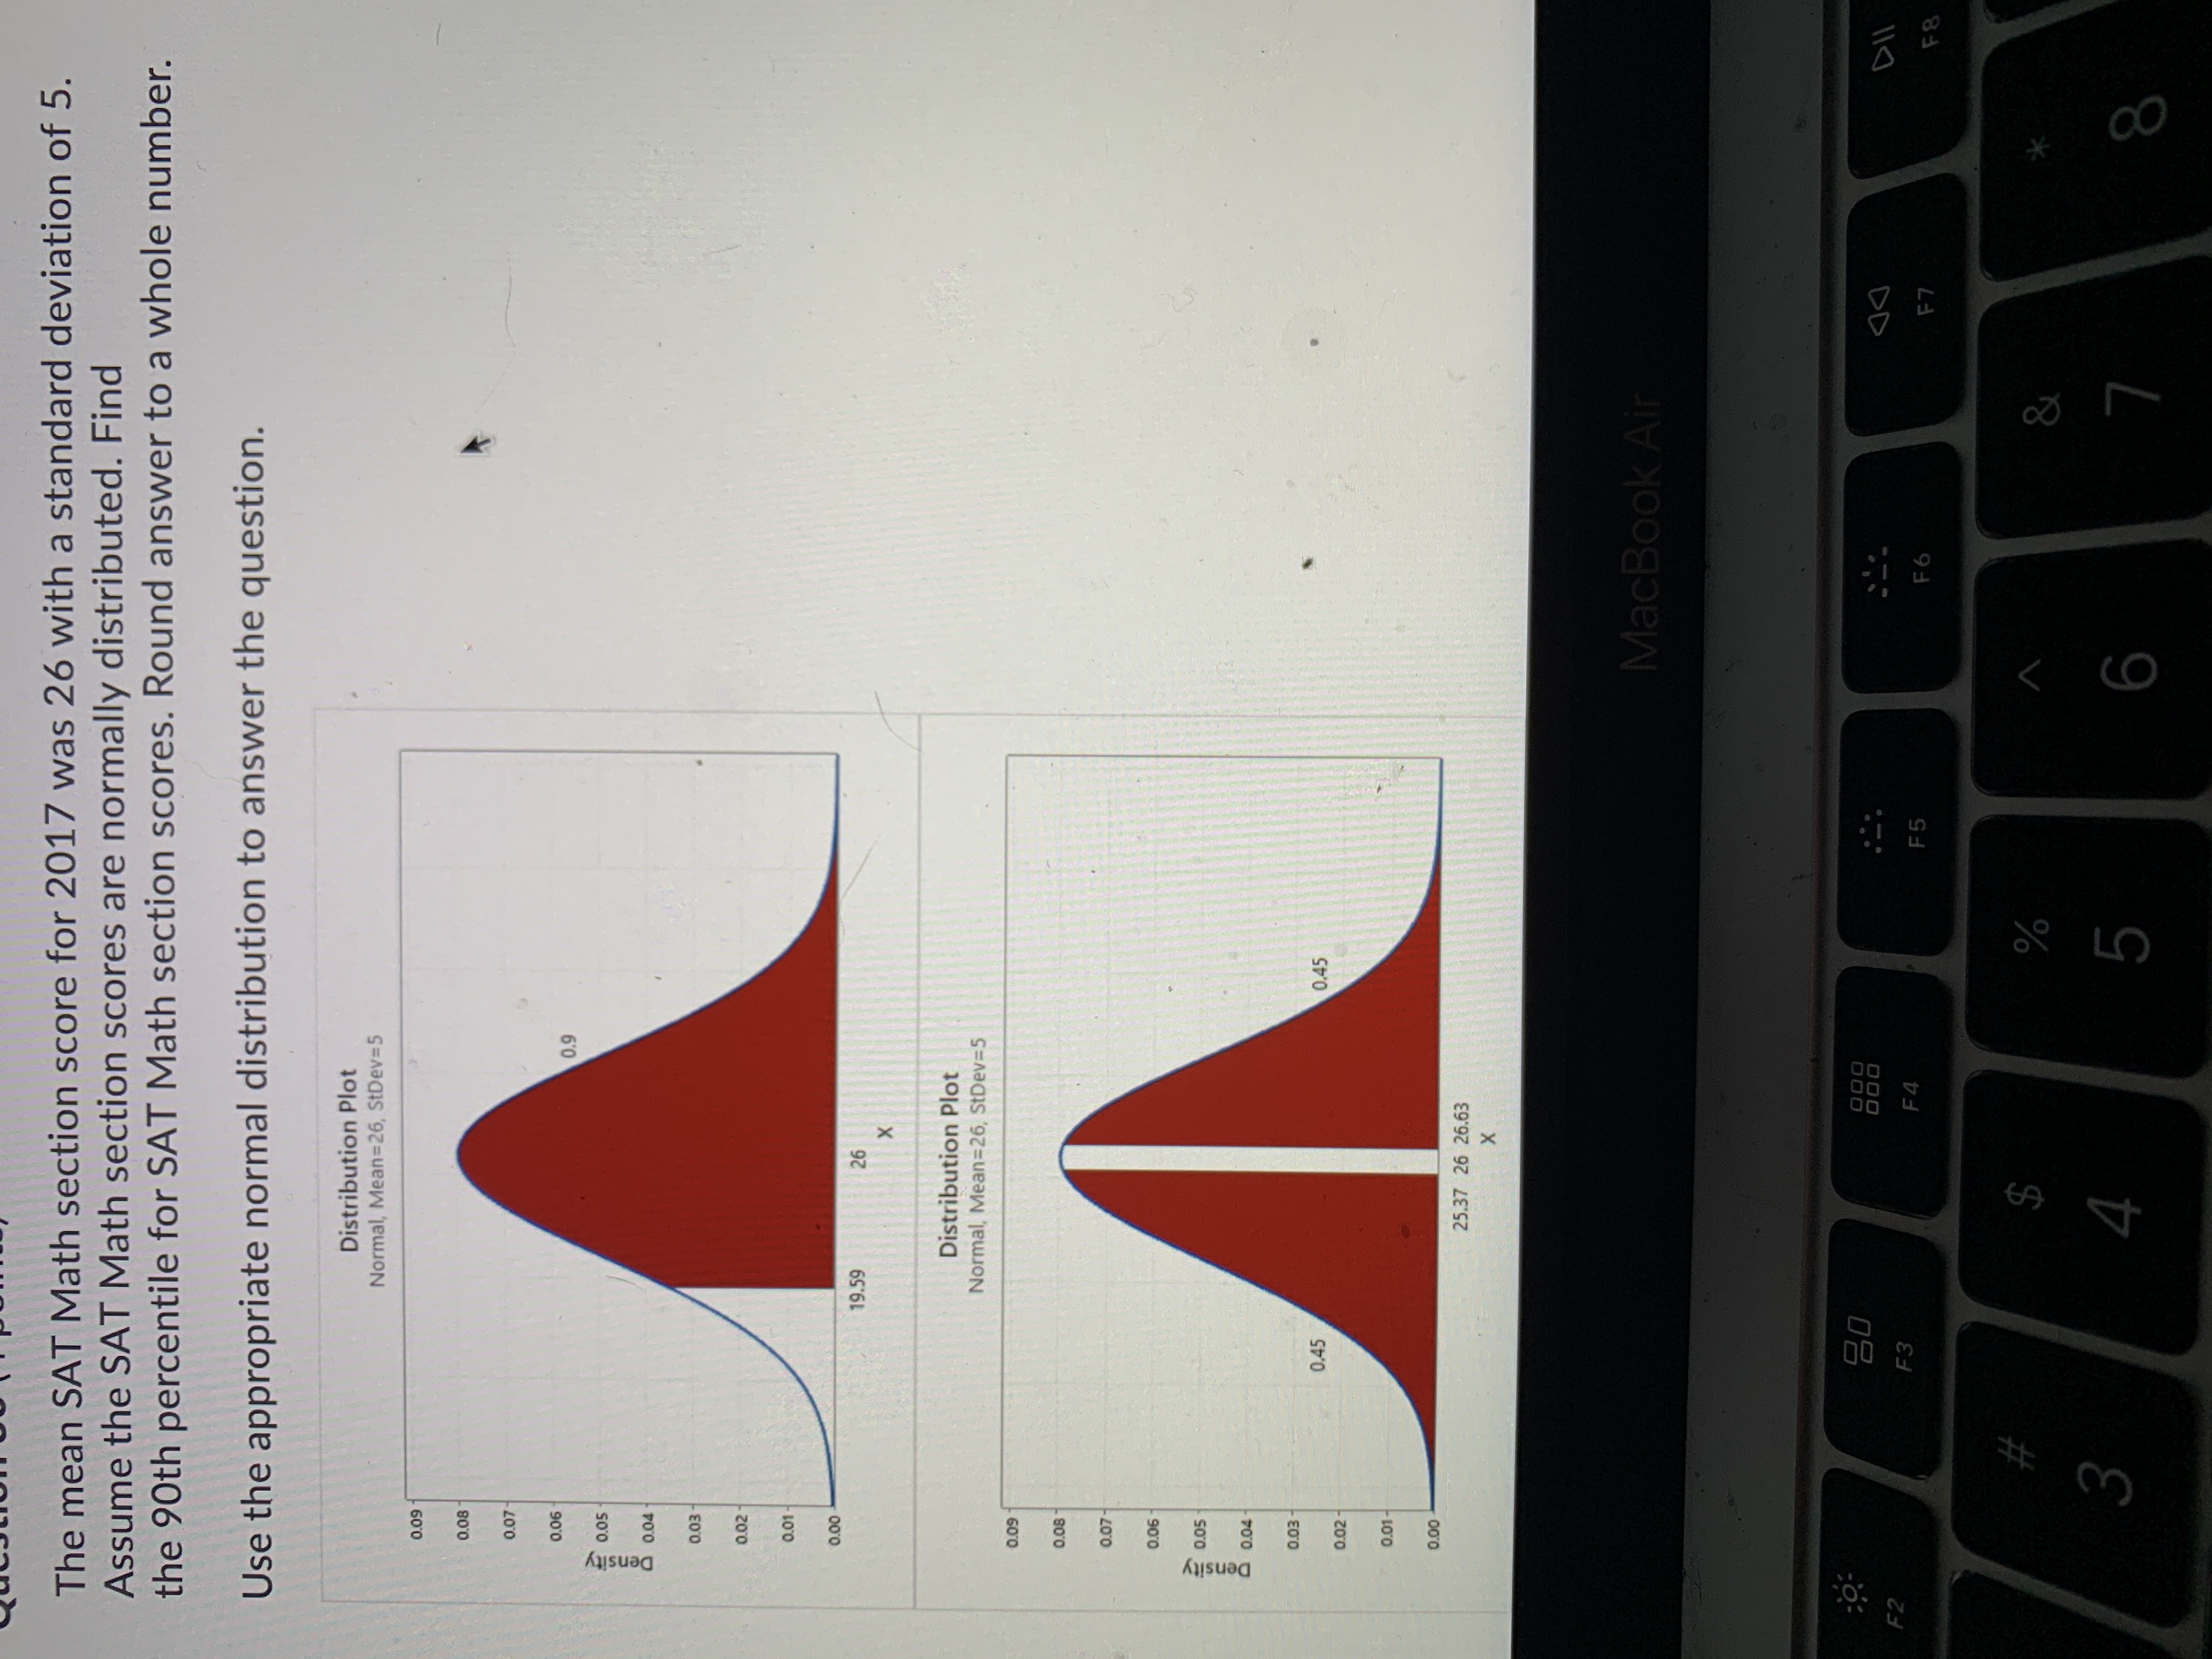
The mean SAT Math section score for 2017 was 26 with a standard deviation of 5. Assume the SAT Math section scores are normally distributed. Find the 90th percentile for SAT Math section scores. Round answer to a whole number. Use the appropriate normal distribution to answer the question. Distribution Plot Normal, Mean=26, StDev=5 0.09 0.08 0.07 0.06 0.9 0.05 Dens 0.04 0.03 0.02 0.01 0.00 19.59 26 Distribution Plot Normal, Mean=26, StDev=5 0.09 0.08 0.07- 0.06 0.05 0.04 0.03 - 0.45 0.45 0.02 0.01 0.00 25.37 26 26.63 X MacBook Air F2 F3 DII F4 F 5 F6 F7 F8 $ % & K 3 4 5 6 J 8
Step by Step Solution
There are 3 Steps involved in it
1 Expert Approved Answer
Step: 1 Unlock

Question Has Been Solved by an Expert!
Get step-by-step solutions from verified subject matter experts
Step: 2 Unlock
Step: 3 Unlock