

Question: The MEANS Procedure Analysis Variable: EPA N Mean Std Dev Median 216 340.854 135.888 381.414 Lower Quartile Upper Quartile 217.469 431.539 Quartile Range Skewness
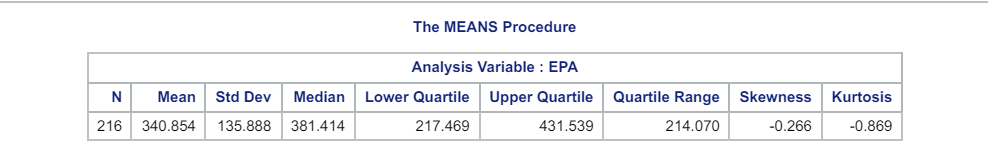
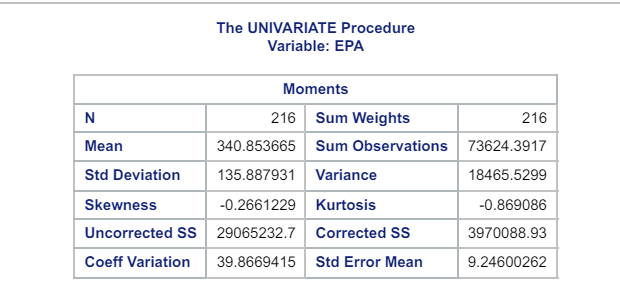
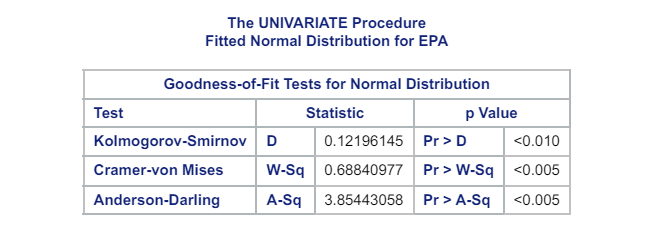
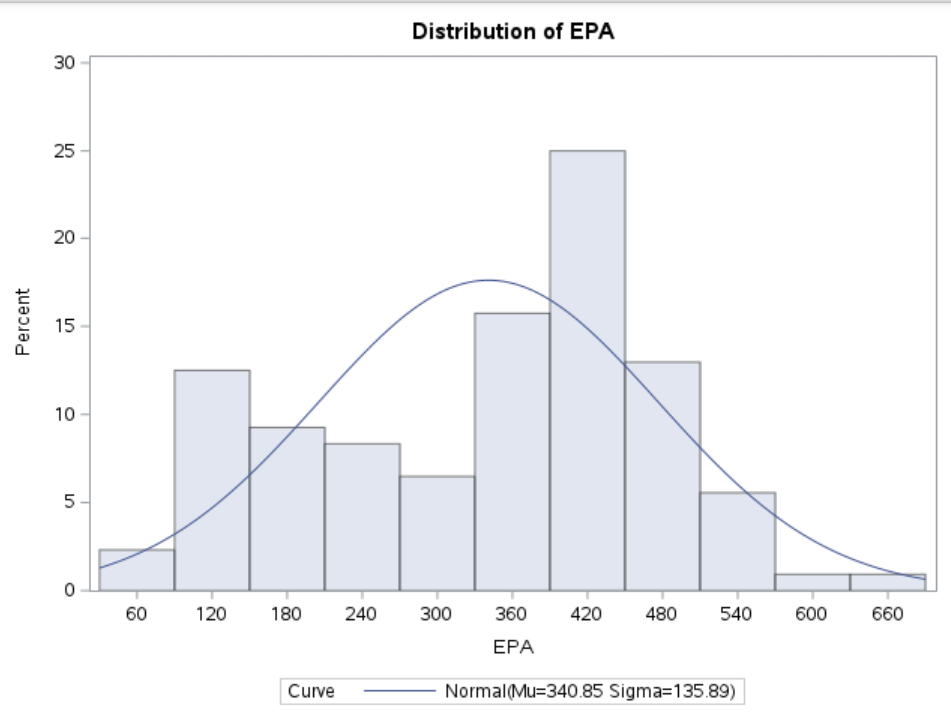
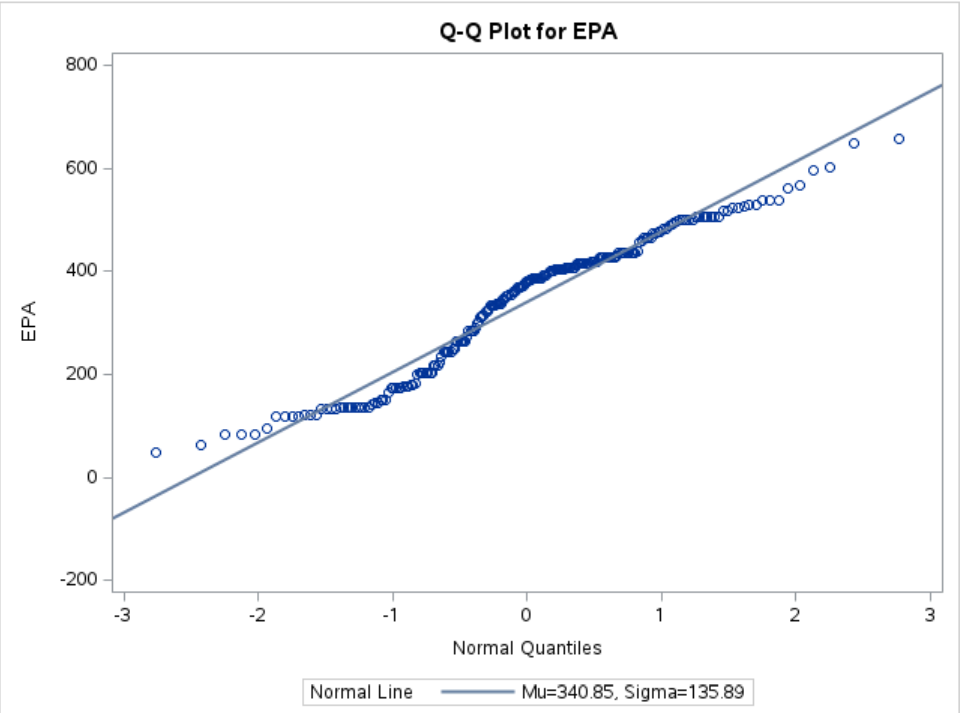
The MEANS Procedure Analysis Variable: EPA N Mean Std Dev Median 216 340.854 135.888 381.414 Lower Quartile Upper Quartile 217.469 431.539 Quartile Range Skewness Kurtosis 214.070 -0.266 -0.869 The UNIVARIATE Procedure Variable: EPA Moments N 216 Sum Weights 216 Mean 340.853665 Sum Observations 73624.3917 Std Deviation 135.887931 Variance 18465.5299 Skewness -0.2661229 Kurtosis -0.869086 Uncorrected SS 29065232.7 Corrected SS 3970088.93 Coeff Variation 39.8669415 Std Error Mean 9.24600262 The UNIVARIATE Procedure Fitted Normal Distribution for EPA Goodness-of-Fit Tests for Normal Distribution Test Statistic p Value Kolmogorov-Smirnov D 0.12196145 Pr> D A-Sq Pr > W-Sq
Step by Step Solution
There are 3 Steps involved in it

Get step-by-step solutions from verified subject matter experts