

Question: The Millard Division's operating data for the past two years are provided below Year 1 123 5800.000 Year 36 5500,00 260. Return on Investment Shareholders
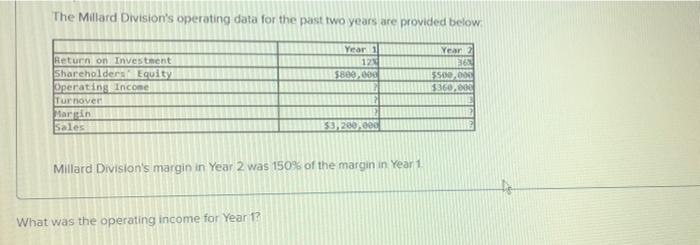
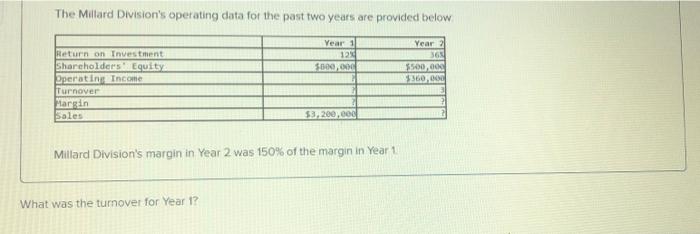
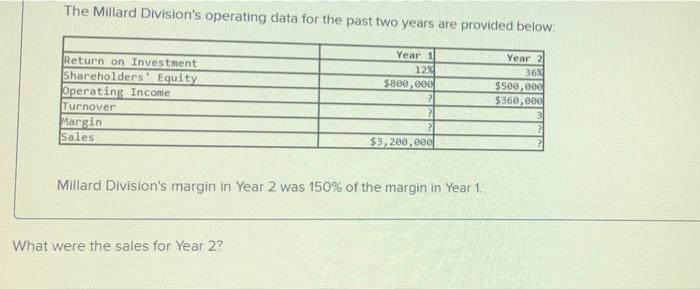
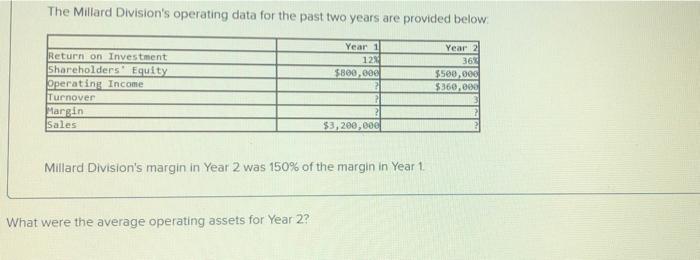
The Millard Division's operating data for the past two years are provided below Year 1 123 5800.000 Year 36 5500,00 260. Return on Investment Shareholders Equity Operating Income Turnover Margin Sales $3200,000 Millard Division's margin in Year 2 was 150% of the margin in Year 1 What was the operating income for Year 1? The Millard Division's operating data for the past two years are provided below Year 1 124 $300,000 Year 2 365 5,500,000 1360,000 Return on Investment Shareholders Equity Operating Income Turnover Margen Sales $3,200,000 Millard Division's margin in Year 2 was 150% of the margin in Year 1 What was the turnover for Year 1? The Millard Division's operating data for the past two years are provided below. Return on Investment Shareholders' Equity Operating Income Turnover Margin Sales Year 11 12 $800,000 2 7 ? $3,200,000 Year 2 36% $500,000 $360,000 3 Millard Division's margin in Year 2 was 150% of the margin in Year 1 What were the sales for Year 2? The Millard Division's operating data for the past two years are provided below Year 1 12 $800,000 Return on Investment Shareholders' Equity Operating Income Turnover Margin Sales Year 36% $500,00 $360,000 $3,200,000 Millard Division's margin in Year 2 was 150% of the margin in Year 1. What were the average operating assets for Year 2
Step by Step Solution
There are 3 Steps involved in it

Get step-by-step solutions from verified subject matter experts