

Question: The Minitab output shown below was obtained by using paired data consisting of weights (in lb) of 31 cars and their highway fuel consumption amounts
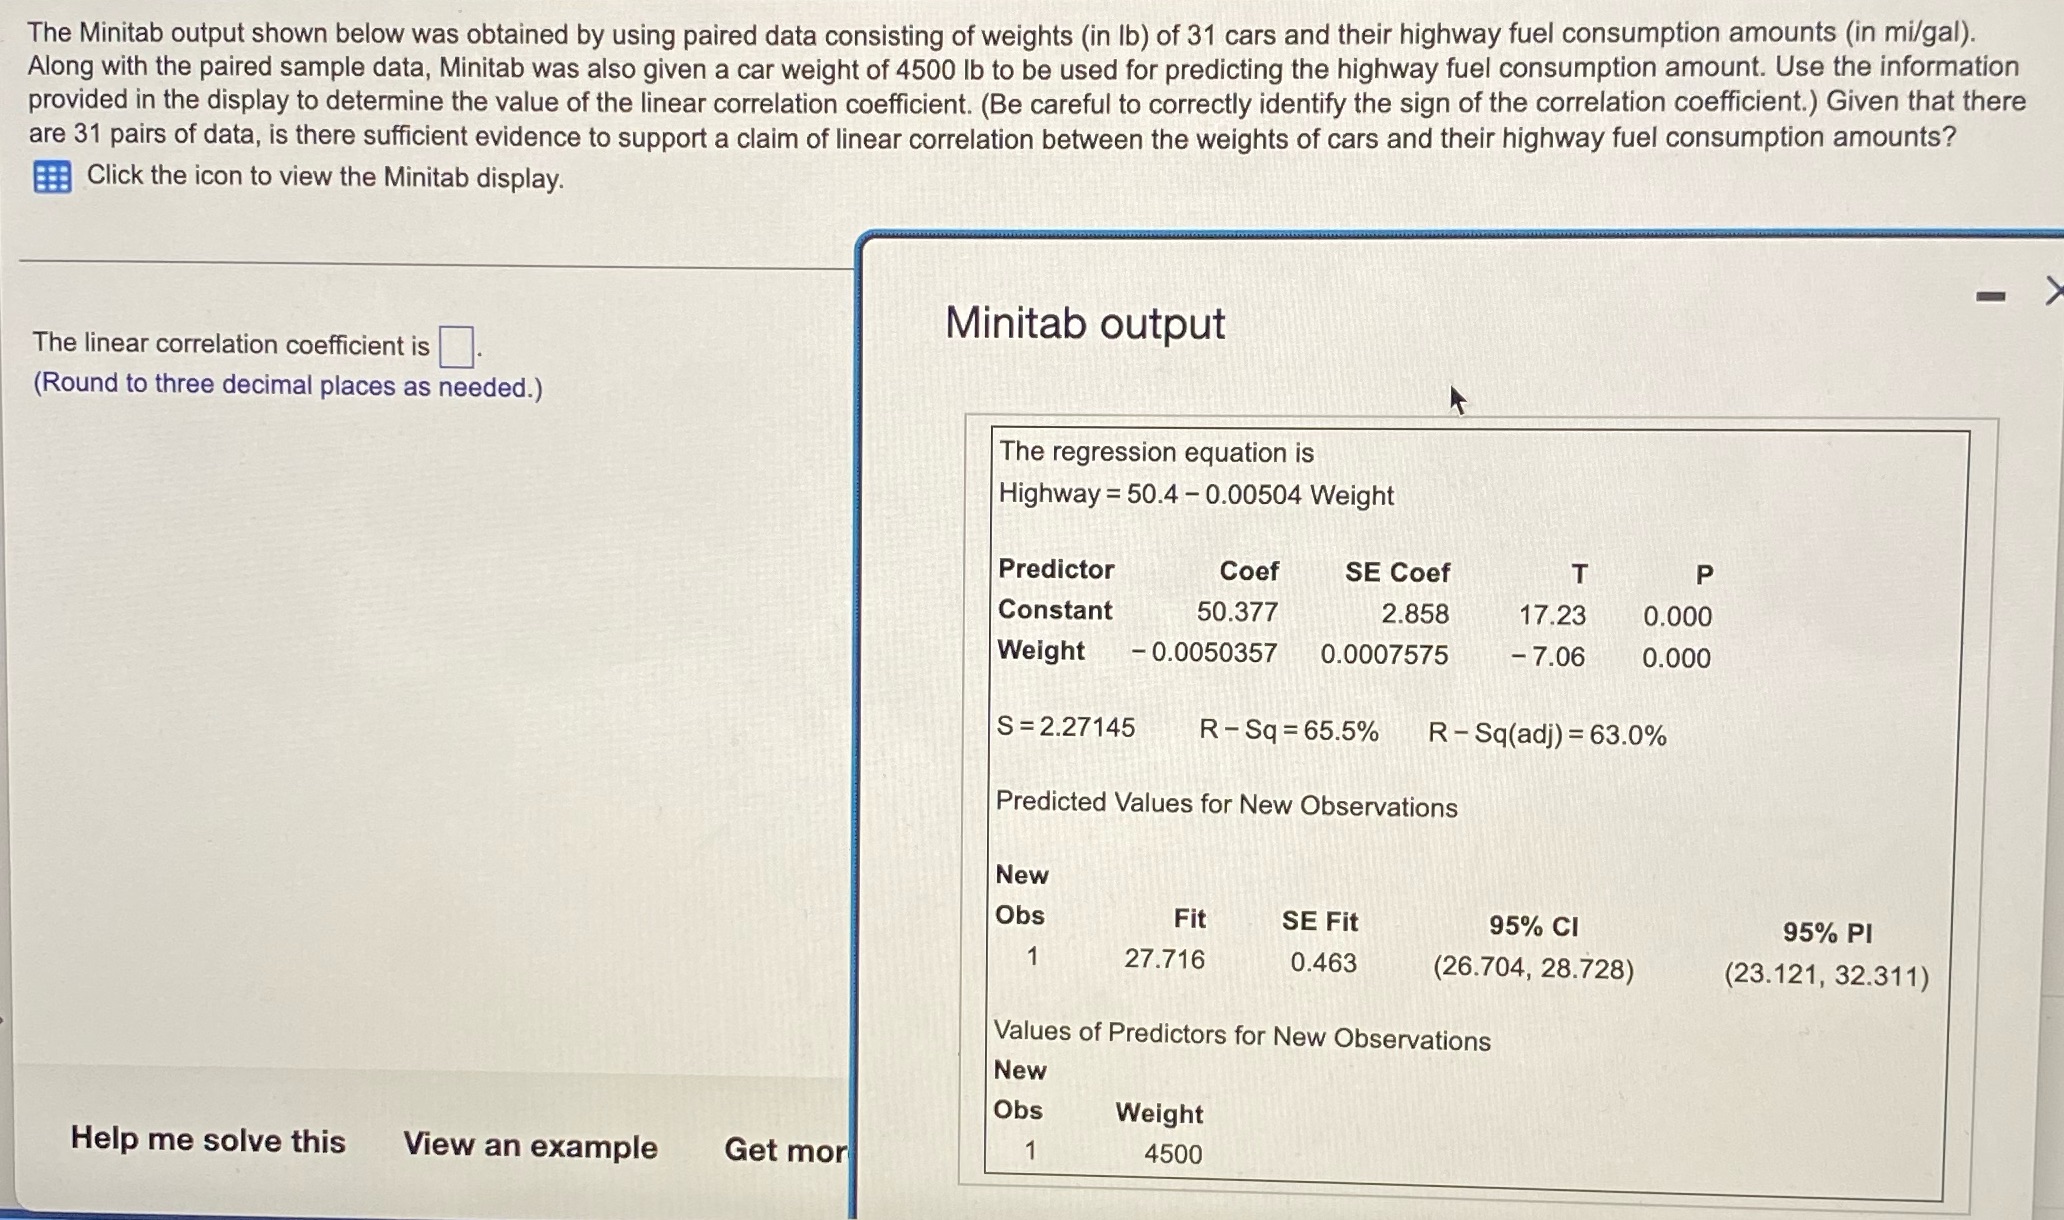
The Minitab output shown below was obtained by using paired data consisting of weights (in lb) of 31 cars and their highway fuel consumption amounts (in mi/gal). Along with the paired sample data, Minitab was also given a car weight of 4500 lb to be used for predicting the highway fuel consumption amount. Use the information provided in the display to determine the value of the linear correlation coefficient. (Be careful to correctly identify the sign of the correlation coefficient.) Given that there are 31 pairs of data, is there sufficient evidence to support a claim of linear correlation between the weights of cars and their highway fuel consumption amounts? Click the icon to view the Minitab display. Minitab output The linear correlation coefficient is. (Round to three decimal places as needed.) The regression equation is Highway = 50.4 - 0.00504 Weight Predictor Coef SE Coef T P Constant 50.377 2.858 17.23 0.000 Weight - 0.0050357 0.0007575 -7.06 0.000 S =2.27145 R - Sq =65.5% R- Sq(adj) = 63.0% Predicted Values for New Observations New Obs Fit SE Fit 95% CI 95% PI 1 27.716 0.463 (26.704, 28.728) (23.121, 32.311) Values of Predictors for New Observations New Obs Weight Help me solve this View an example Get mor 4500
Step by Step Solution
There are 3 Steps involved in it

Get step-by-step solutions from verified subject matter experts