

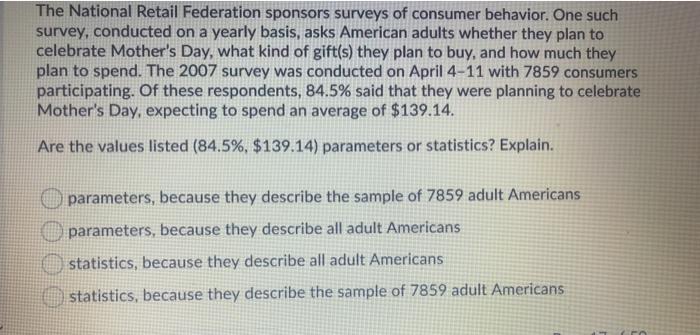
The National Retail Federation sponsors surveys of consumer behavior. One such survey, conducted on a yearly...
Fantastic news! We've Found the answer you've been seeking!
Question:
Expert Answer:
The detailed answer for the above question is provided below Answer 1 The correct answer ... View the full answer

Related Book For 

Statistics The Exploration & Analysis Of Data
ISBN: 9780840058010
7th Edition
Authors: Roxy Peck, Jay L. Devore
Posted Date:
