

Question: The next 4 questions relate to the same boxplot graph, shown below. Question 4 of 8 Question4 The boxplots below show amount spent for vehicles
The next 4 questions relate to the same boxplot graph, shown below.
Question 4 of 8
Question4
The boxplots below show amount spent for vehicles in two neighboring locations (in thousands of dollars).

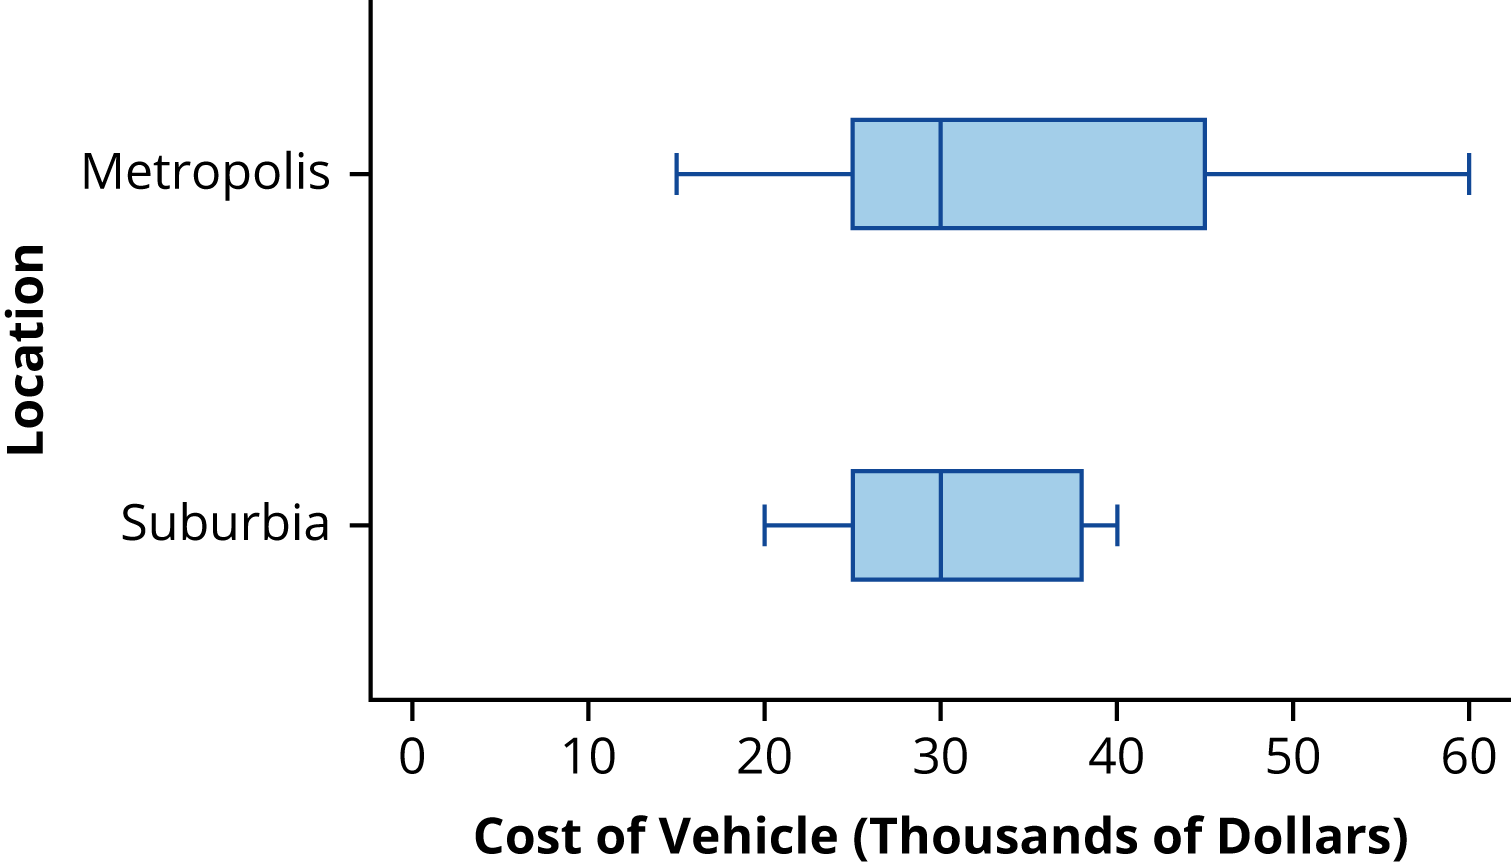


Metropolis Location Suburbia O 10 20 30 40 50 60 Cost of Vehicle (Thousands of Dollars)Metropolis Location Suburbia O 10 20 30 40 50 60 Cost of Vehicle (Thousands of Dollars)Metropolis Location Suburbia O 10 20 30 40 50 60 Cost of Vehicle (Thousands of Dollars)Metropolis Location Suburbia O 10 20 30 40 50 60 Cost of Vehicle (Thousands of Dollars)
Step by Step Solution
There are 3 Steps involved in it
1 Expert Approved Answer
Step: 1 Unlock

Question Has Been Solved by an Expert!
Get step-by-step solutions from verified subject matter experts
Step: 2 Unlock
Step: 3 Unlock