

Question: The next image is the format on excel: Consider the following means for stocks A through F, along with a variance-covariance matrix. The risk- free
The next image is the format on excel:
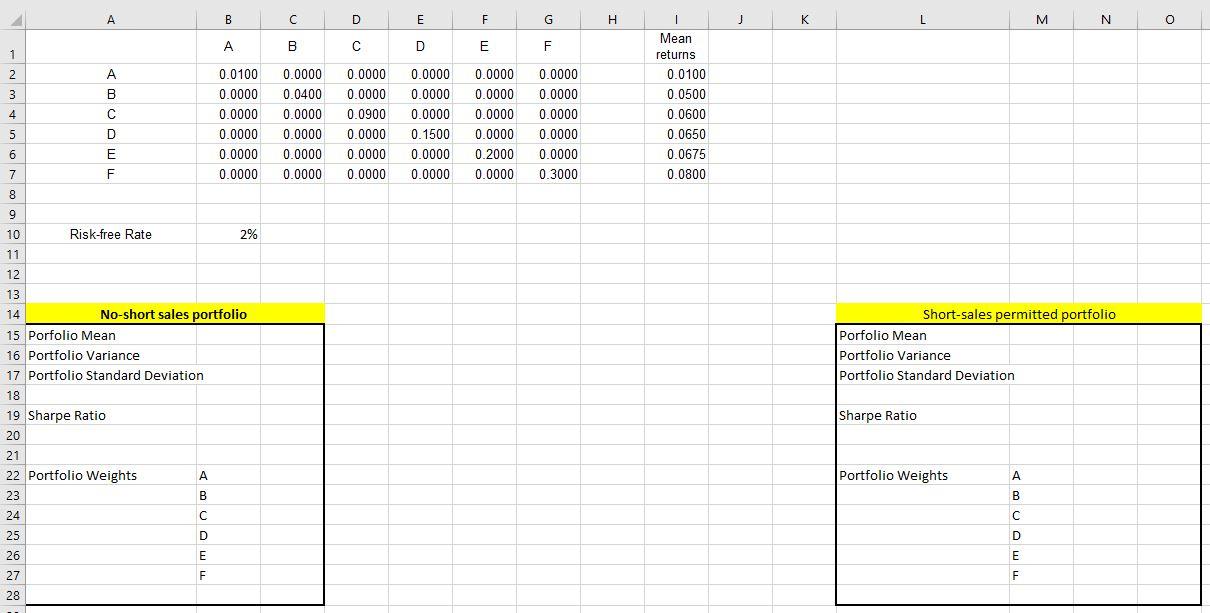
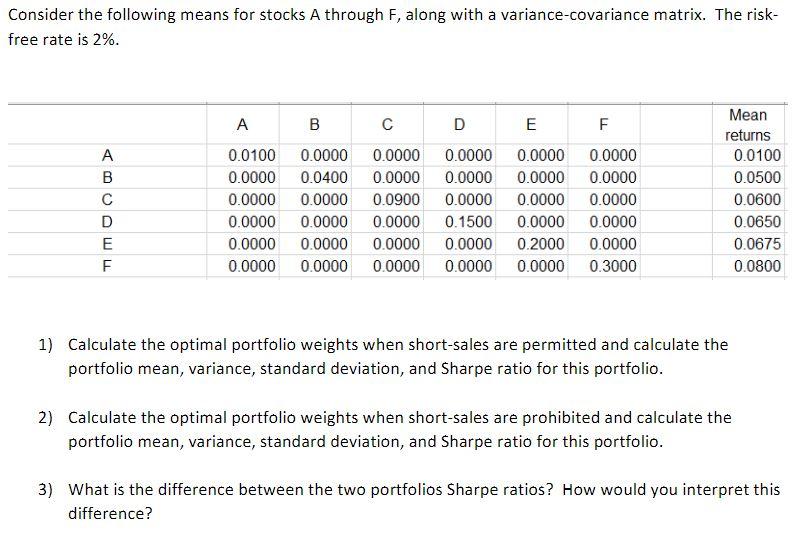
Consider the following means for stocks A through F, along with a variance-covariance matrix. The risk- free rate is 2%. A B D Tim UUD D 0.0100 0.0000 0.0000 0.0000 0.0000 0.0000 0.0000 0.0400 0.0000 0.0000 0.0000 0.0000 0.0000 0.0000 0.0900 0.0000 0.0000 0.0000 0.0000 0.0000 0.0000 0.1500 0.0000 0.0000 E F 0.0000 0.0000 0.0000 0.0000 0.0000 0.0000 0.0000 0.0000 0.2000 0.0000 0.0000 0.3000 Mean returns 0.0100 0.0500 0.0600 0.0650 0.0675 0.0800 1) Calculate the optimal portfolio weights when short-sales are permitted and calculate the portfolio mean, variance, standard deviation, and Sharpe ratio for this portfolio. 2) Calculate the optimal portfolio weights when short-sales are prohibited and calculate the portfolio mean, variance, standard deviation, and Sharpe ratio for this portfolio. 3) What is the difference between the two portfolios Sharpe ratios? How would you interpret this difference? A B C D E F G H J K L M N 0 . B D E F 1 2 . B 3 4 0.0100 0.0000 0.0000 0.0000 0.0000 0.0000 C D 0.0000 0.0400 0.0000 0.0000 0.0000 0.0000 0.0000 0.0000 0.0900 0.0000 0.0000 0.0000 0.0000 0.0000 0.0000 0.1500 0.0000 0.0000 Mean returns 0.0100 0.0500 0.0600 0.0650 0.0675 0.0800 0.0000 0.0000 0.0000 0.0000 0.2000 0.0000 0.0000 0.0000 0.0000 0.0000 0.0000 0.3000 5 6 E 7 F 8 9 Risk-free Rate 2% 10 11 12 Short-sales permitted portfolio Porfolio Mean Portfolio Variance Portfolio Standard Deviation 13 14 No-short sales portfolio 15 Porfolio Mean 16 Portfolio Variance 17 Portfolio Standard Deviation 18 19 Sharpe Ratio 20 21 22 Portfolio Weights A 23 B Sharpe Ratio Portfolio Weights A B 24 25 D D 26 E E F F 27 28 Consider the following means for stocks A through F, along with a variance-covariance matrix. The risk- free rate is 2%. A B D Tim UUD D 0.0100 0.0000 0.0000 0.0000 0.0000 0.0000 0.0000 0.0400 0.0000 0.0000 0.0000 0.0000 0.0000 0.0000 0.0900 0.0000 0.0000 0.0000 0.0000 0.0000 0.0000 0.1500 0.0000 0.0000 E F 0.0000 0.0000 0.0000 0.0000 0.0000 0.0000 0.0000 0.0000 0.2000 0.0000 0.0000 0.3000 Mean returns 0.0100 0.0500 0.0600 0.0650 0.0675 0.0800 1) Calculate the optimal portfolio weights when short-sales are permitted and calculate the portfolio mean, variance, standard deviation, and Sharpe ratio for this portfolio. 2) Calculate the optimal portfolio weights when short-sales are prohibited and calculate the portfolio mean, variance, standard deviation, and Sharpe ratio for this portfolio. 3) What is the difference between the two portfolios Sharpe ratios? How would you interpret this difference? A B C D E F G H J K L M N 0 . B D E F 1 2 . B 3 4 0.0100 0.0000 0.0000 0.0000 0.0000 0.0000 C D 0.0000 0.0400 0.0000 0.0000 0.0000 0.0000 0.0000 0.0000 0.0900 0.0000 0.0000 0.0000 0.0000 0.0000 0.0000 0.1500 0.0000 0.0000 Mean returns 0.0100 0.0500 0.0600 0.0650 0.0675 0.0800 0.0000 0.0000 0.0000 0.0000 0.2000 0.0000 0.0000 0.0000 0.0000 0.0000 0.0000 0.3000 5 6 E 7 F 8 9 Risk-free Rate 2% 10 11 12 Short-sales permitted portfolio Porfolio Mean Portfolio Variance Portfolio Standard Deviation 13 14 No-short sales portfolio 15 Porfolio Mean 16 Portfolio Variance 17 Portfolio Standard Deviation 18 19 Sharpe Ratio 20 21 22 Portfolio Weights A 23 B Sharpe Ratio Portfolio Weights A B 24 25 D D 26 E E F F 27 28
Step by Step Solution
There are 3 Steps involved in it

Get step-by-step solutions from verified subject matter experts