

Question: The next problem comes from economics. A simple input-output exchange model in economics deals with how much of an economic sector's output is purchased by
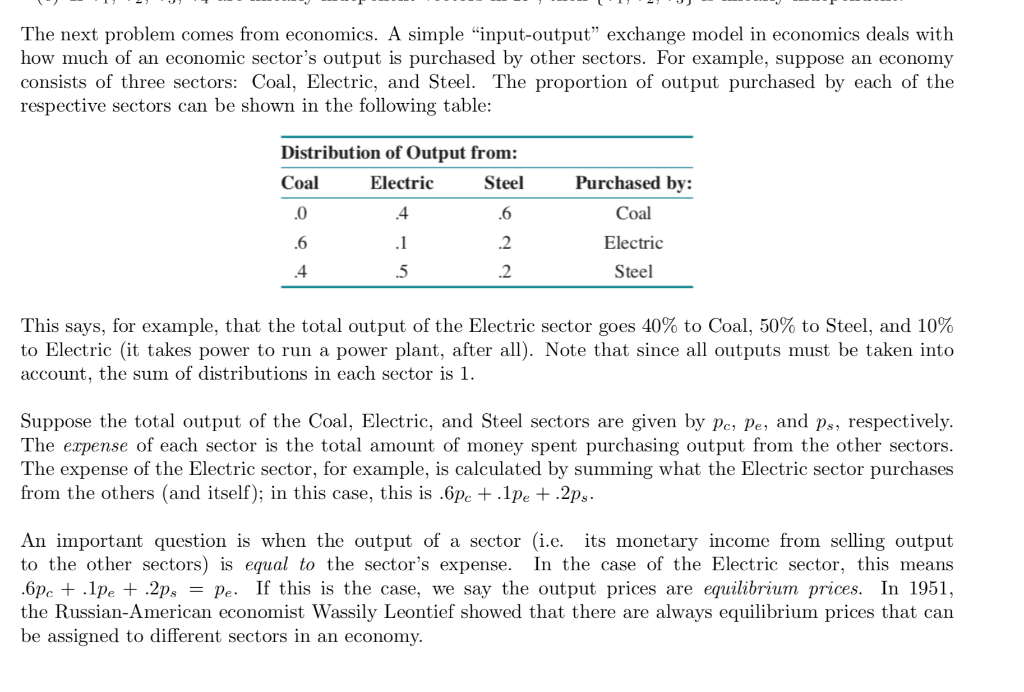
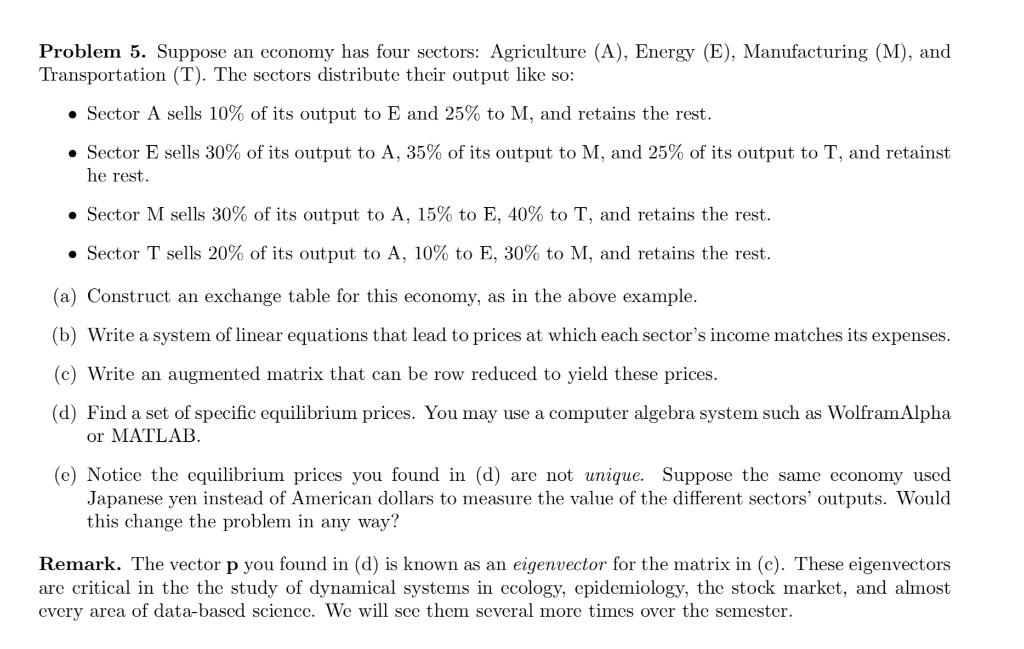
The next problem comes from economics. A simple "input-output" exchange model in economics deals with how much of an economic sector's output is purchased by other sectors. For example, suppose an economy consists of three sectors: Coal, Electric, and Steel. The proportion of output purchased by each of the respective sectors can be shown in the following table: Distribution of Output from: Coal Electric Steel . 04 Purchased by: Coal Electric Steel This says, for example, that the total output of the Electric sector goes 40% to Coal, 50% to Steel, and 10% to Electric (it takes power to run a power plant, after all). Note that since all outputs must be taken into account, the sum of distributions in each sector is 1. Suppose the total output of the Coal, Electric, and Steel sectors are given by pc, pe, and Ps, respectively. The expense of each sector is the total amount of money spent purchasing output from the other sectors. The expense of the Electric sector, for example, is calculated by summing what the Electric sector purchases from the others (and itself); in this case, this is .pe +.1pe +.2ps. An important question is when the output of a sector (i.e. its monetary income from selling output to the other sectors) is equal to the sector's expense. In the case of the Electric sector, this means .6pc + .lpe + 2ps = pe. If this is the case, we say the output prices are equilibrium prices. In 1951, the Russian-American economist Wassily Leontief showed that there are always equilibrium prices that can be assigned to different sectors in an economy. Problem 5. Suppose an economy has four sectors: Agriculture (A), Energy (E), Manufacturing (M), and Transportation (T). The sectors distribute their output like so: Sector A sells 10% of its output to E and 25% to M, and retains the rest. Sector E sells 30% of its output to A, 35% of its output to M, and 25% of its output to T, and retainst he rest. Sector M sells 30% of its output to A, 15% to E, 40% to T, and retains the rest. Sector T sells 20% of its output to A, 10% to E, 30% to M, and retains the rest. (a) Construct an exchange table for this economy, as in the above example. (b) Write a system of linear equations that lead to prices at which each sector's income matches its expenses. (c) Write an augmented matrix that can be row reduced to yield these prices. (d) Find a set of specific equilibrium prices. You may use a computer algebra system such as Wolfram Alpha or MATLAB (e) Notice the equilibrium prices you found in (d) are not unique. Suppose the same economy used Japanese yen instead of American dollars to measure the value of the different sectors' outputs. Would this change the problem in any way? Remark. The vector p you found in (d) is known as an eigenvector for the matrix in (C). These eigenvectors are critical in the the study of dynamical systems in ecology, epidemiology, the stock market, and almost every area of data-based science. We will see them several more times over the semester. The next problem comes from economics. A simple "input-output" exchange model in economics deals with how much of an economic sector's output is purchased by other sectors. For example, suppose an economy consists of three sectors: Coal, Electric, and Steel. The proportion of output purchased by each of the respective sectors can be shown in the following table: Distribution of Output from: Coal Electric Steel . 04 Purchased by: Coal Electric Steel This says, for example, that the total output of the Electric sector goes 40% to Coal, 50% to Steel, and 10% to Electric (it takes power to run a power plant, after all). Note that since all outputs must be taken into account, the sum of distributions in each sector is 1. Suppose the total output of the Coal, Electric, and Steel sectors are given by pc, pe, and Ps, respectively. The expense of each sector is the total amount of money spent purchasing output from the other sectors. The expense of the Electric sector, for example, is calculated by summing what the Electric sector purchases from the others (and itself); in this case, this is .pe +.1pe +.2ps. An important question is when the output of a sector (i.e. its monetary income from selling output to the other sectors) is equal to the sector's expense. In the case of the Electric sector, this means .6pc + .lpe + 2ps = pe. If this is the case, we say the output prices are equilibrium prices. In 1951, the Russian-American economist Wassily Leontief showed that there are always equilibrium prices that can be assigned to different sectors in an economy. Problem 5. Suppose an economy has four sectors: Agriculture (A), Energy (E), Manufacturing (M), and Transportation (T). The sectors distribute their output like so: Sector A sells 10% of its output to E and 25% to M, and retains the rest. Sector E sells 30% of its output to A, 35% of its output to M, and 25% of its output to T, and retainst he rest. Sector M sells 30% of its output to A, 15% to E, 40% to T, and retains the rest. Sector T sells 20% of its output to A, 10% to E, 30% to M, and retains the rest. (a) Construct an exchange table for this economy, as in the above example. (b) Write a system of linear equations that lead to prices at which each sector's income matches its expenses. (c) Write an augmented matrix that can be row reduced to yield these prices. (d) Find a set of specific equilibrium prices. You may use a computer algebra system such as Wolfram Alpha or MATLAB (e) Notice the equilibrium prices you found in (d) are not unique. Suppose the same economy used Japanese yen instead of American dollars to measure the value of the different sectors' outputs. Would this change the problem in any way? Remark. The vector p you found in (d) is known as an eigenvector for the matrix in (C). These eigenvectors are critical in the the study of dynamical systems in ecology, epidemiology, the stock market, and almost every area of data-based science. We will see them several more times over the semester
Step by Step Solution
There are 3 Steps involved in it

Get step-by-step solutions from verified subject matter experts