

Question: The next three questions are based on a food-processing factory, where the weight of cans of beans is monitored by weighing a sample of five
The next three questions are based on a food-processing factory, where the weight of cans of beans is monitored by weighing a sample of five randomly picked cans each day. The manufacturing process has been in control for the past several weeks, with the mean of sample means equaling 27.93 oz. and the range of sample means equaling 2.33 oz.
1)What are the appropriate upper and lower control limits for the X-chart that will be used to monitor these weights? (Please show how to solve for A2)
2) What are the appropriate upper and lower control limits for the R-chart?
3) New sampling results of the weights of samples of cans for this week are listed below. Is the process still in control?
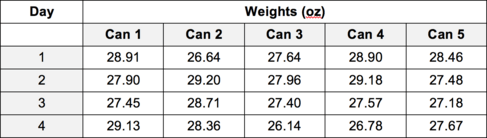
Day 1 Can 2 26.64 29.20 28.71 Weights (oz) Can 3 27.64 27.96 27.40 Can 1 28.91 27.90 27.45 29.13 N 2 3 Can 4 28.90 29.18 27.57 26.78 Can 5 28.46 27.48 27.18 27.67 3 4 28.36 26.14
Step by Step Solution
There are 3 Steps involved in it

Get step-by-step solutions from verified subject matter experts