

Question: The Normal Distribution - Practice Ref. V.2030 Example Given the following frequency distribution table for the approx. number of people in Uganda in 2011
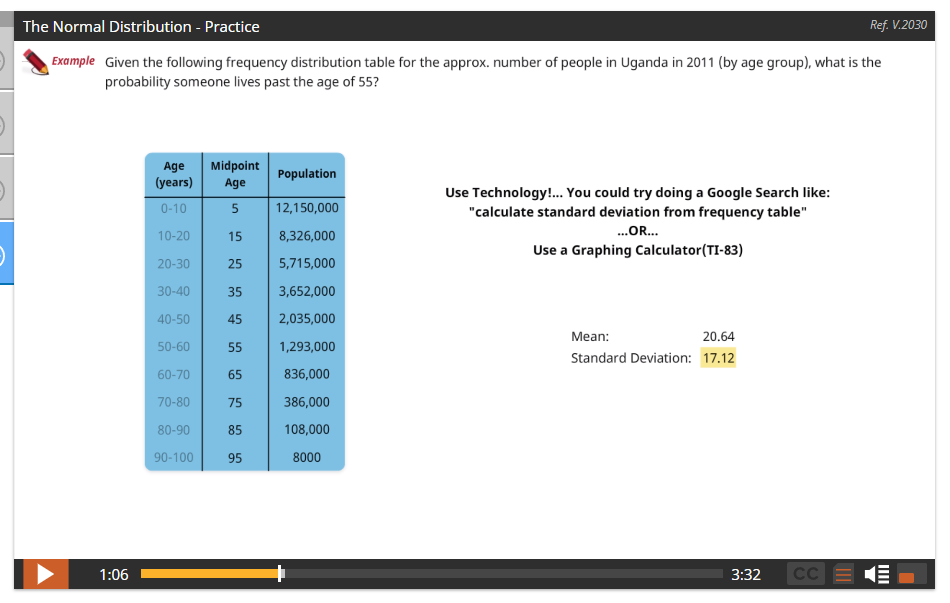
The Normal Distribution - Practice Ref. V.2030 Example Given the following frequency distribution table for the approx. number of people in Uganda in 2011 (by age group), what is the probability someone lives past the age of 55? 1:06 Age Midpoint (years) Age Population 0-10 5 12,150,000 Use Technology!... You could try doing a Google Search like: "calculate standard deviation from frequency table" 10-20 15 8,326,000 ...OR... Use a Graphing Calculator(TI-83) 20-30 25 5,715,000 30-40 35 3,652,000 40-50 45 2,035,000 Mean: 20.64 50-60 55 1,293,000 Standard Deviation: 17.12 60-70 65 836,000 70-80 75 386,000 80-90 85 108,000 90-100 95 8000 3:32 CC
Step by Step Solution
There are 3 Steps involved in it

Get step-by-step solutions from verified subject matter experts