

Question: The null hypothesis: At least two population means are not equal 2.The null hypothesis: All population means are not equal. 3.The null hypothesis: All populationmeans
The null hypothesis:
At least two population means are not equal
2.The null hypothesis:
All population means are not equal.
3.The null hypothesis:
All populationmeans differ.
4.The null hypothesis:
All population means are equal.
5.The alternative hypothesis:
At least two population means are not equal.
6.The alternative hypothesis:
All population means are not equal?.
7.The alternative hypothesis:
All population means differ.
8.The alternative hypothesis:
All population means are equal.
9.Test statistic is 29.600
10.Test statistic is 0.868
11.Test statistic is 34.100
12.Test statistic is 0.445
13.P-value is 0.001
14.P-value is 0.868
15.P-value is 0.010
16.P-value is 0.445
17.Decision: Reject the null hypothesis and conclude that there is difference between at least two the means number of spam for two populations.
18.Decision: Do not reject the null hypothesis which states there are no difference in means number of spam for three populations.
19.Decision: Reject the null hypothesis and conclude that there are difference among the means number of spam for the three populations.
20.Decision: Do not reject the null hypothesis which states that there are difference among means number of spam for at least two populations.
21.The significant difference is between:Professors and students
22.The significant difference is between:Professors and administrators?
23.The significant difference is between:Administrators and students?
24.The significant difference is between:No significant difference
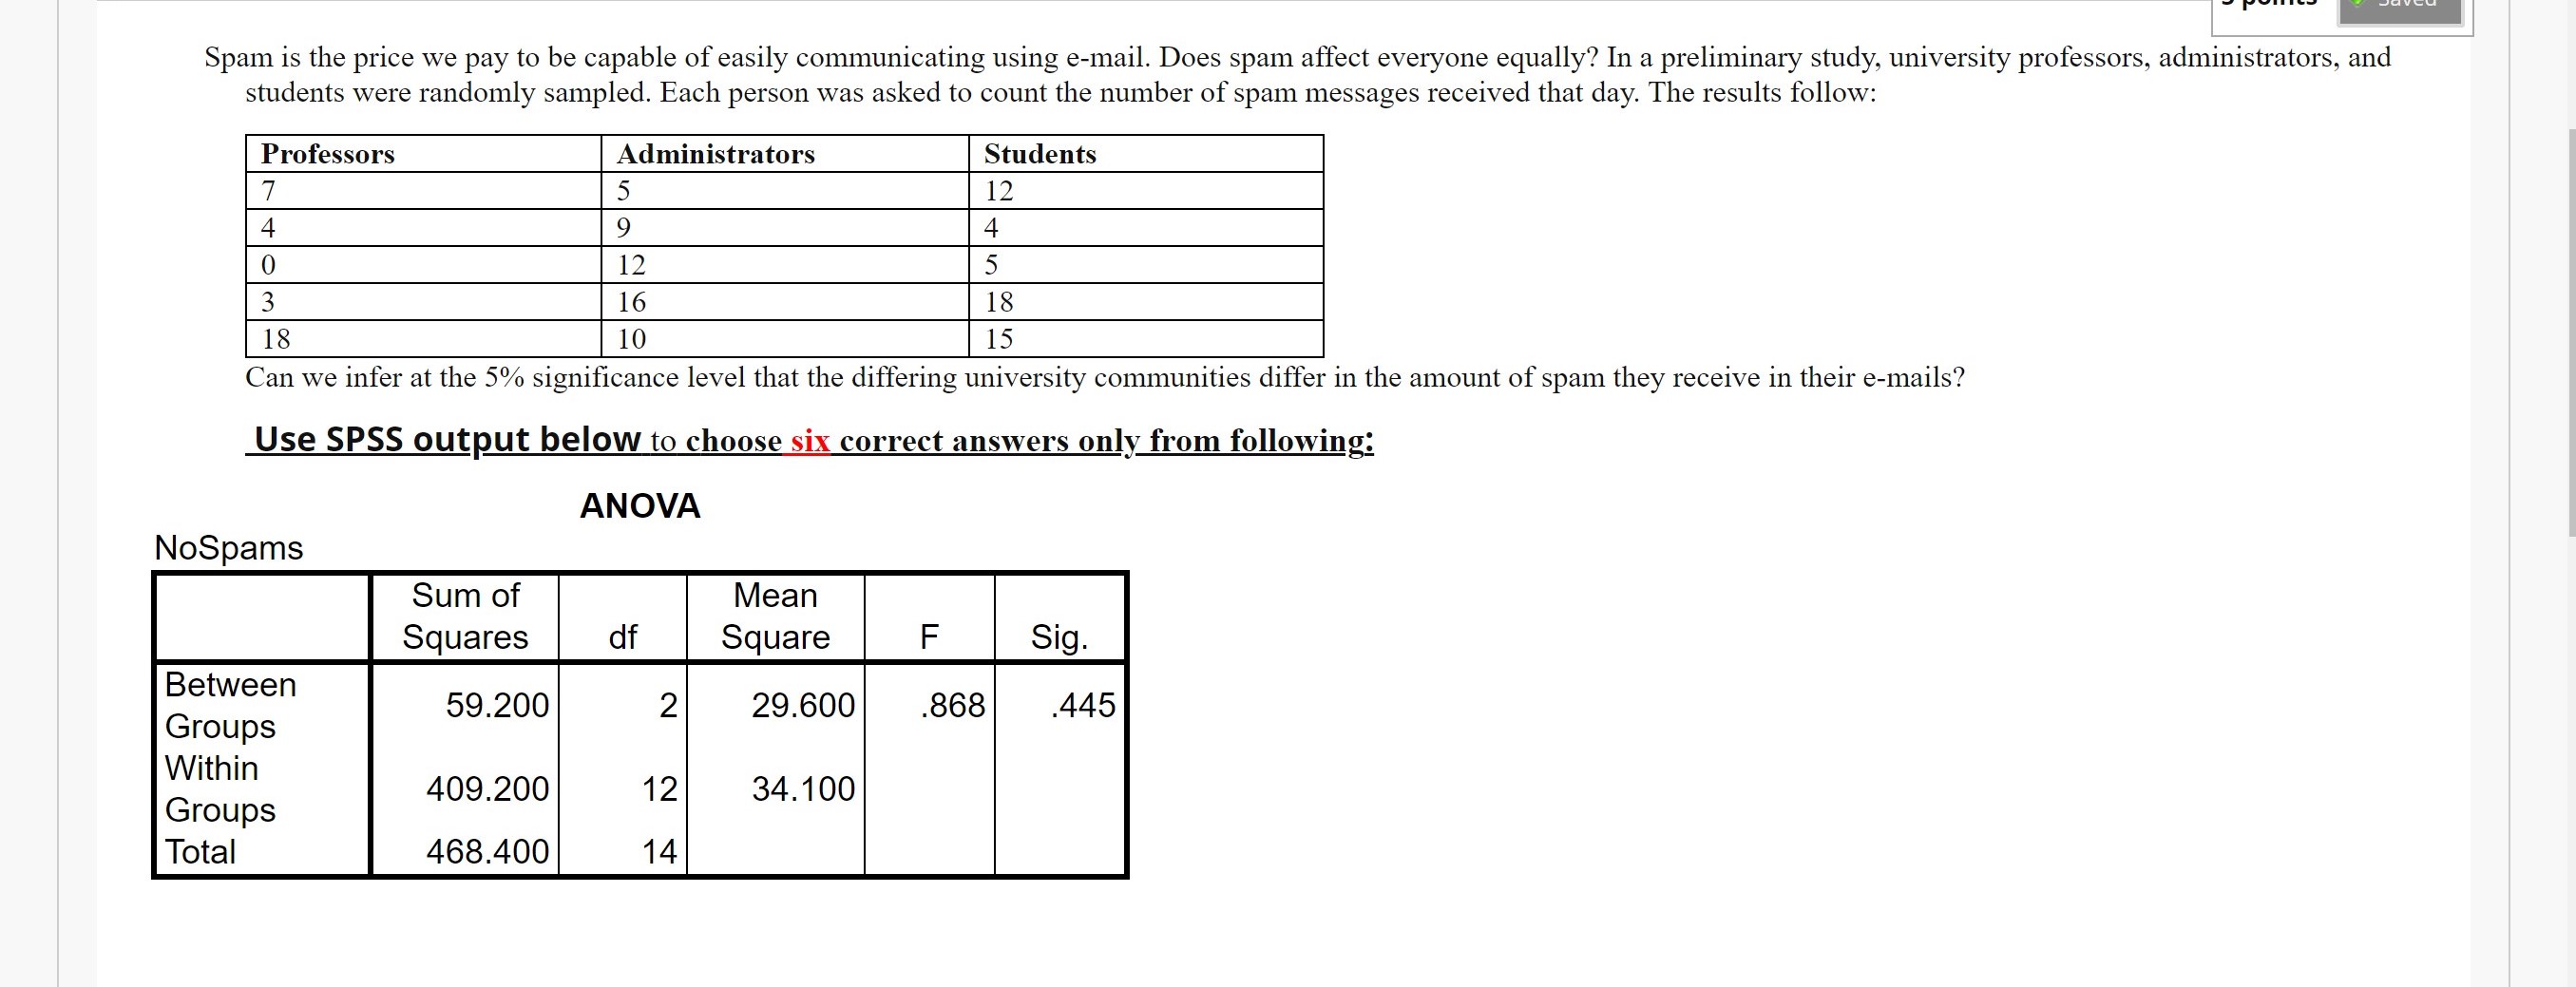
Spam is the price we pay to be capable of easily communicating using e-mail. Does spam affect everyone equally? In a preliminary study, university professors, administrators, and students were randomly sampled. Each person was asked to count the number of spam messages received that day. The results follow: Professors Administrators Students 7 5 12 4 9 4 0 12 5 3 16 18 18 10 15 Can we infer at the 5% significance level that the differing university communities differ in the amount of spam they receive in their e-mails? Use SPSS output below to choose six correct answers only from following: ANOVA NoSpams Sum of Mean Squares df Square F Sig Between 59.200 2 29.600 868 445 Groups Within 409.200 12 34.100 Groups Total 468.400 14
Step by Step Solution
There are 3 Steps involved in it

Get step-by-step solutions from verified subject matter experts